


fig4
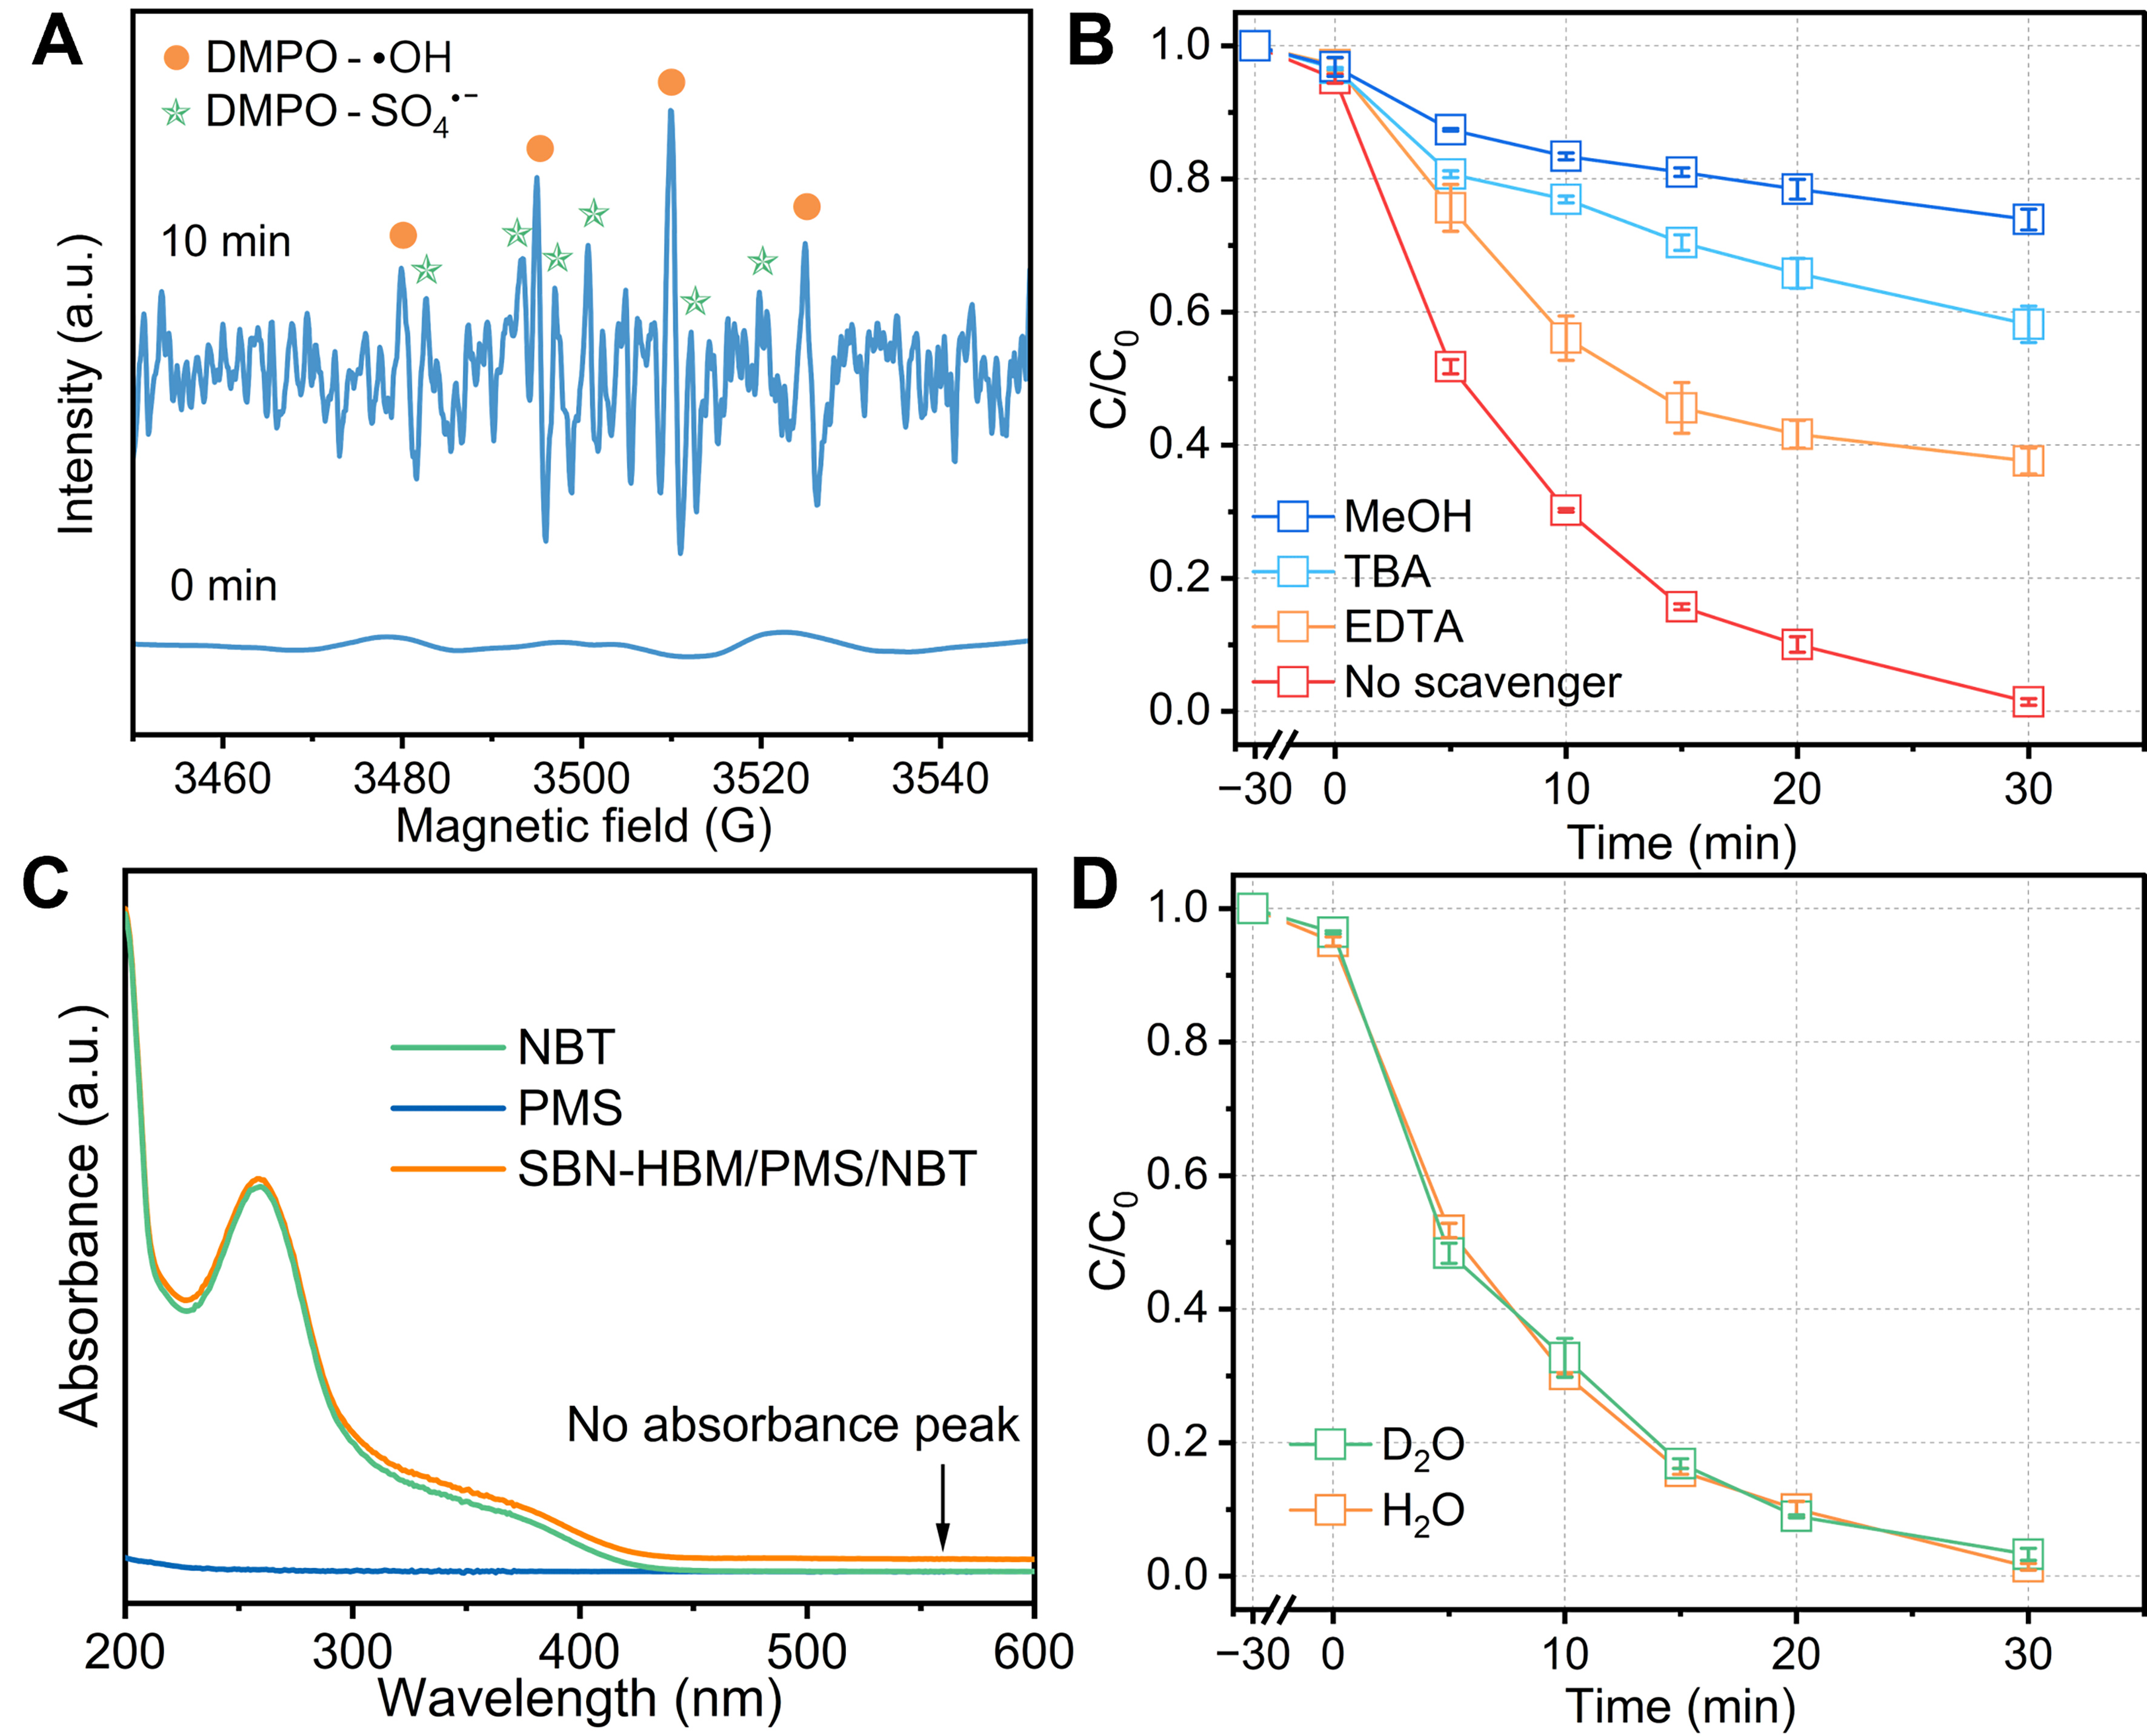
Figure 4. (A) EPR signal of •OH/SO4•- over SBN-HBM/PMS system; (B) RhB degradation curves of the SBN-HBM/PMS system in the presence of different scavengers; (C) UV-vis spectra of NBT systems; (D) RhB degradation curves in H2O and D2O. Results are reported as the average ± SD (n = 3). EPR: Electron paramagnetic resonance; SBN: Sr0.5Ba0.5Nb2O6; HBM: high-energy ball milling; PMS: peroxymonosulfate; RhB: Rhodamine B; UV-vis: ultraviolet-visible; NBT: 4-nitro blue tetrazolium chloride; D2O: deuterium oxide; SD: standard deviation; DMPO: 5,5-dimethyl-1-pyrroline N-oxide; TBA: tert-butyl alcohol; EDTA: ethylenediaminetetraacetic acid disodium salt.


