




fig9
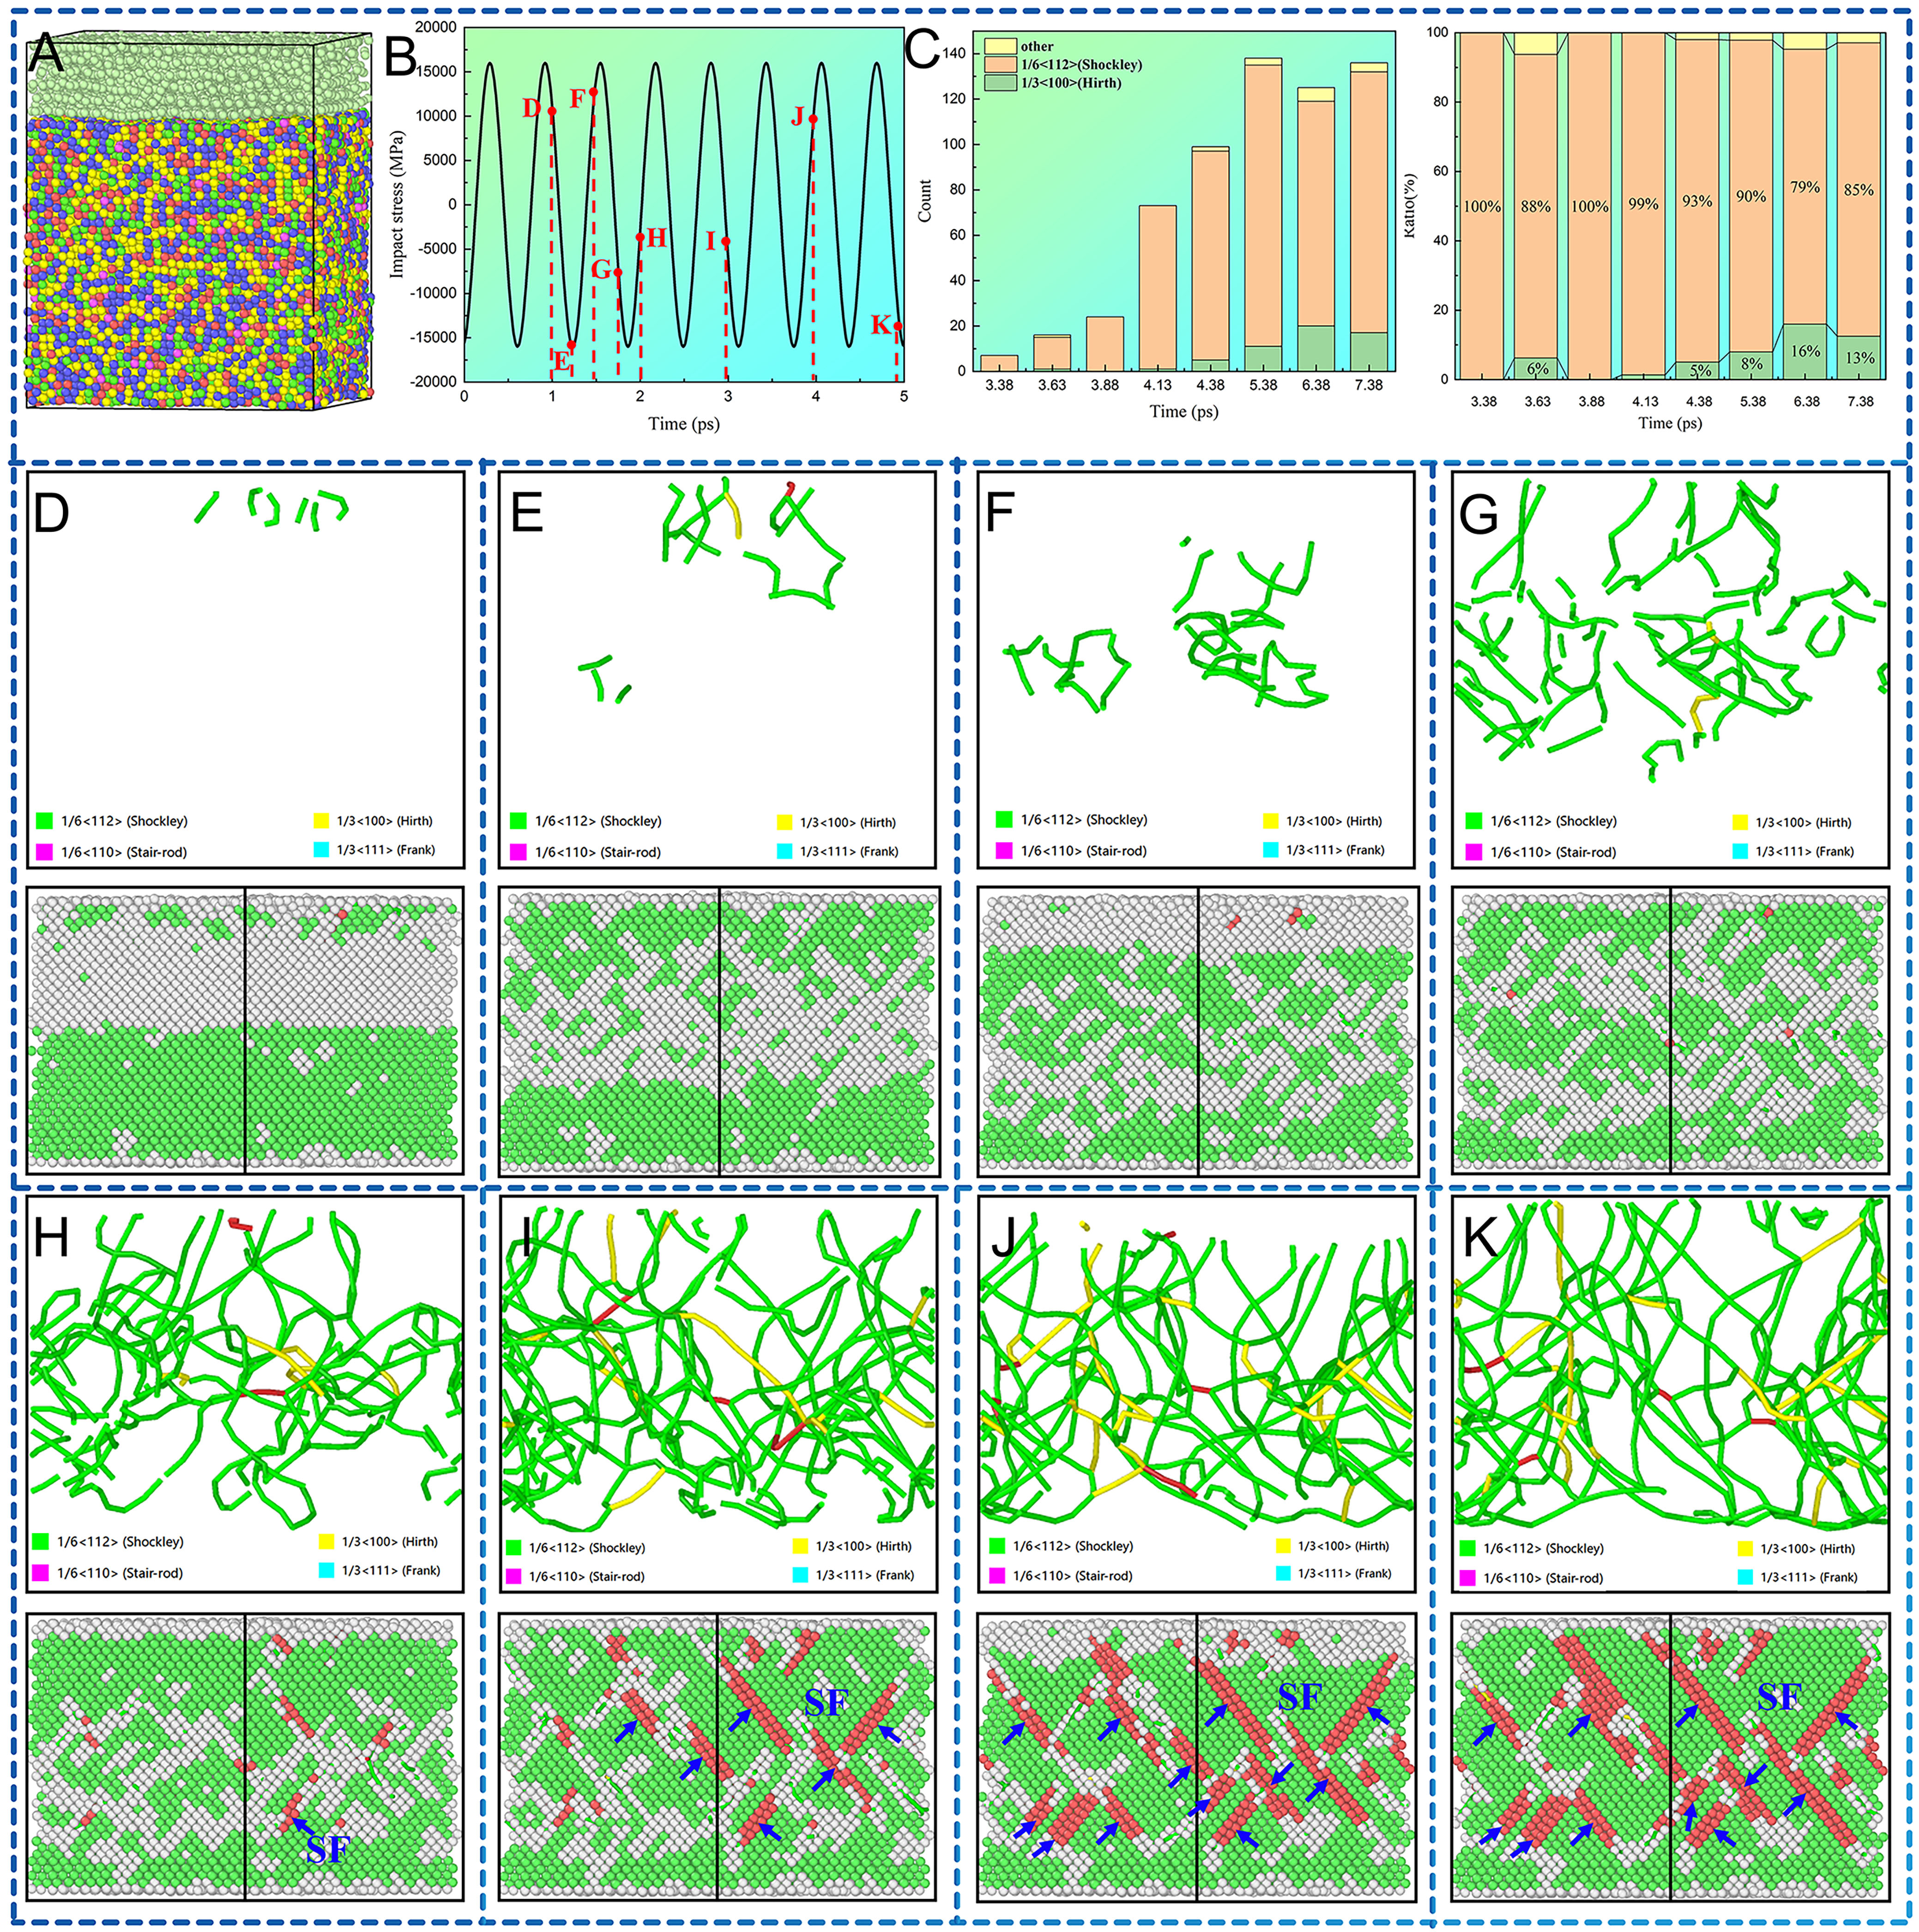
Figure 9. MD results of UIT-(CoCrNi)94(TiAl)6 MEAs. (A) crystal structure model. (B) ultrasonic impact-stress waveform. The black curve represents the applied impact stress as a function of time, the red circles indicate the impact-stress values at the specific time points corresponding to Figure 9D-K, and the red dashed lines mark the exact time positions of these frames; (C) number and proportion of dislocations; (D-K) evolution of dislocations and stacking faults. MD: Molecular dynamics; UIT: ultrasonic impact treatment; MEA: medium-entropy alloy.





