




fig4
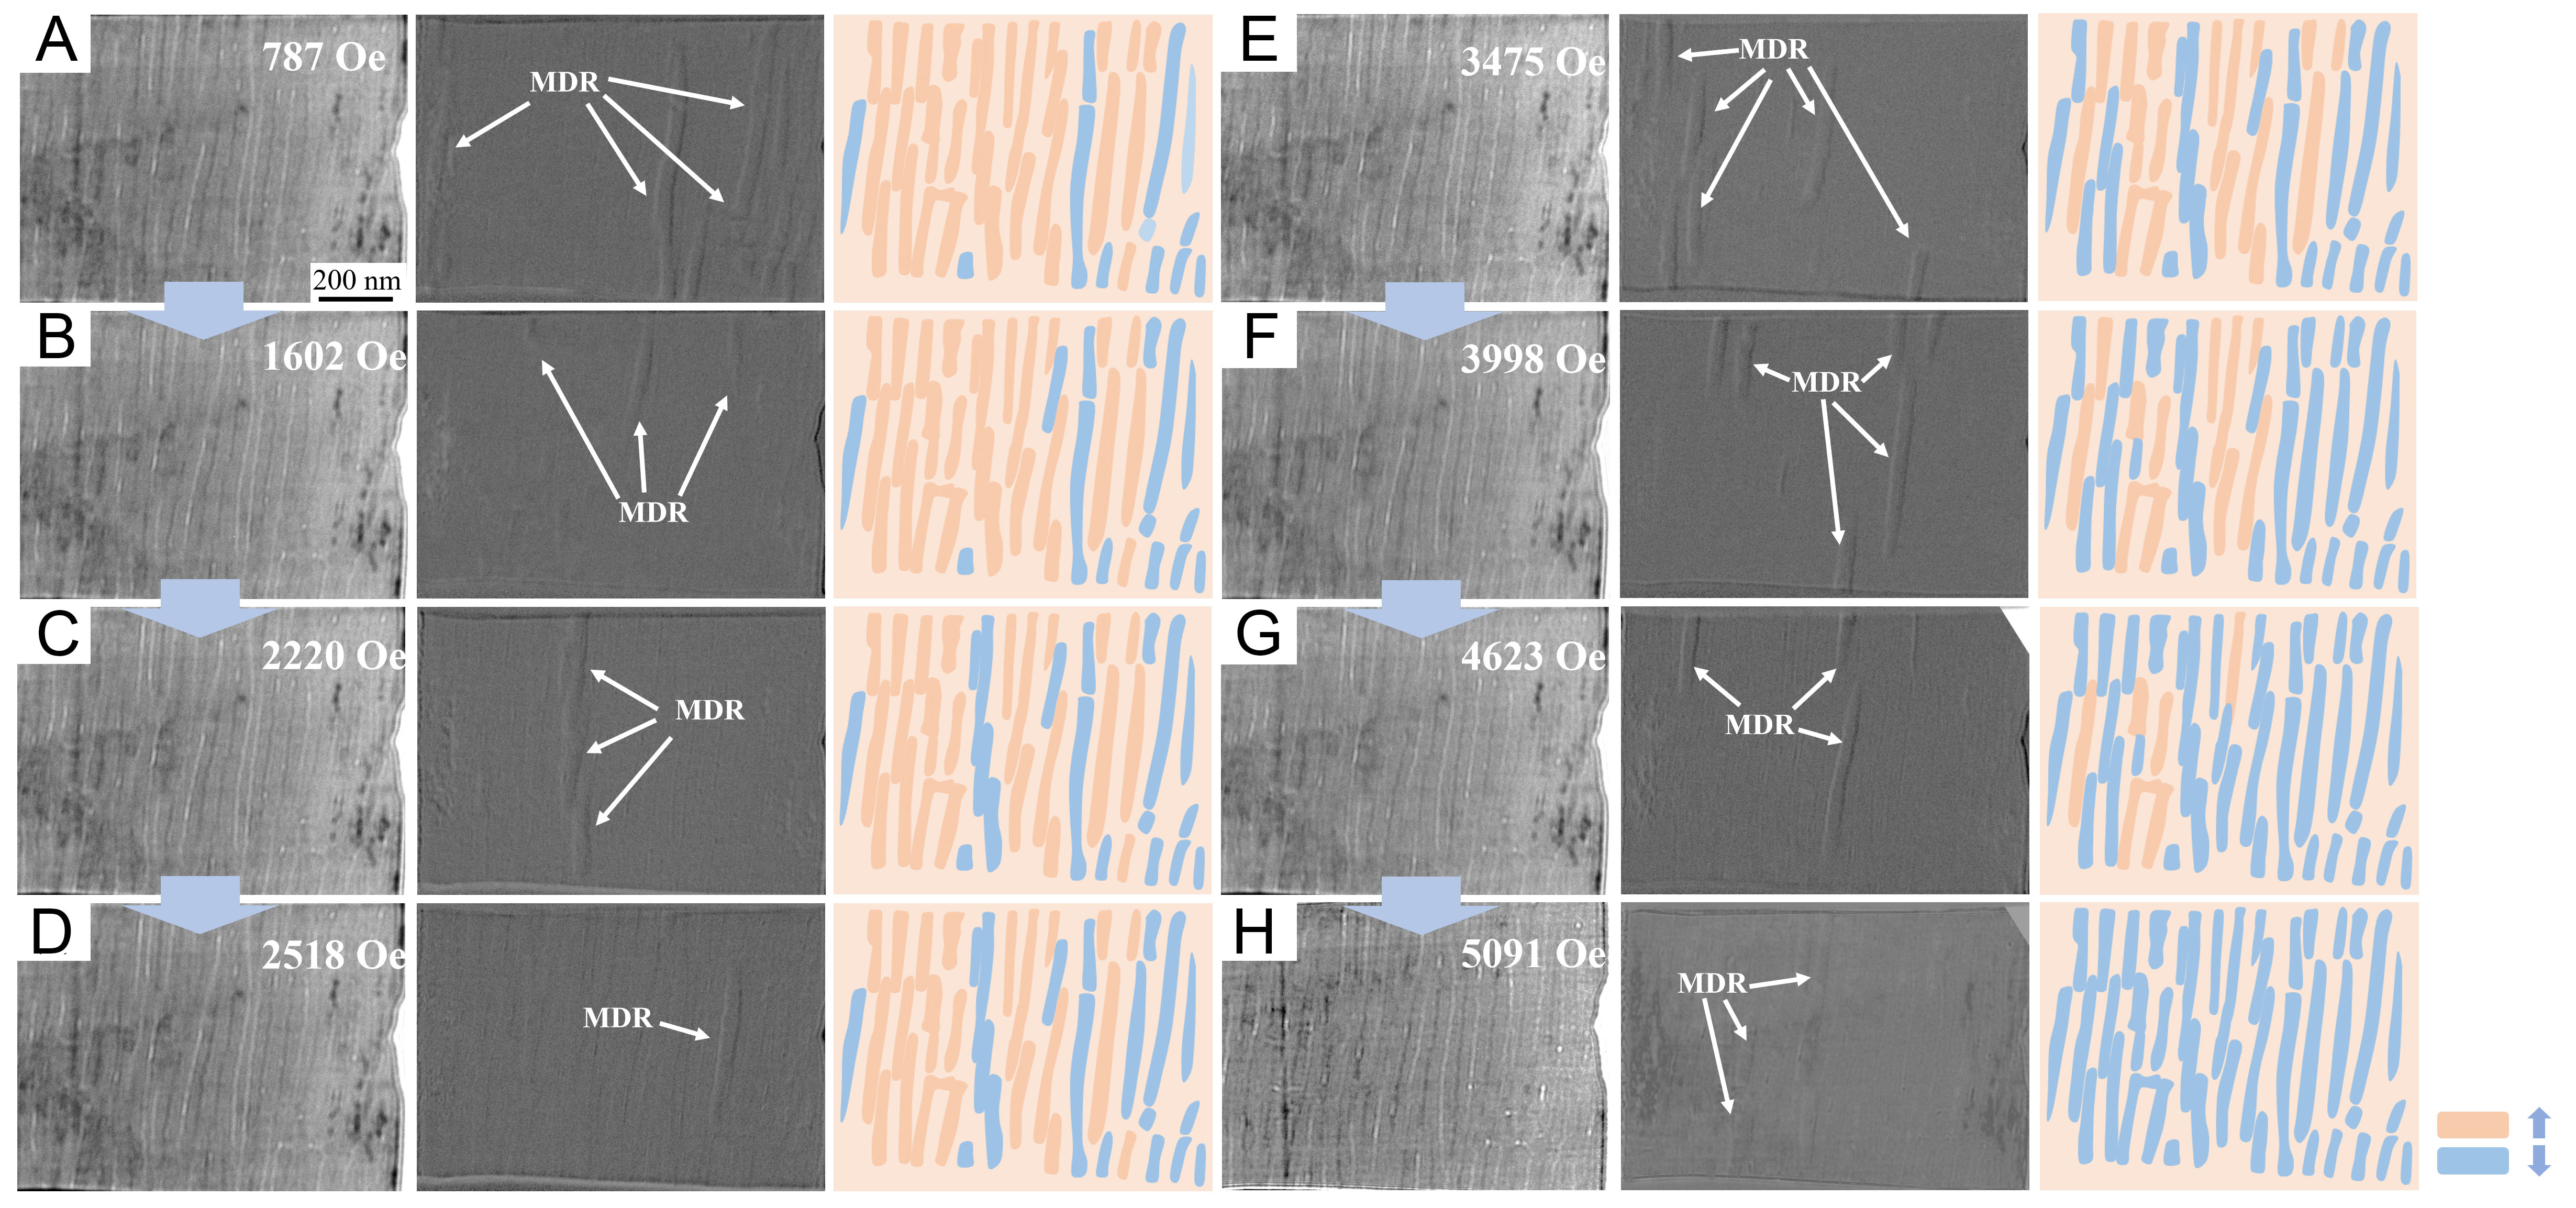
Figure 4. In situ magnetic domain evolution of the sample under increasing applied magnetic fields. (A-H) correspond to applied fields of 787 Oe, 1,602 Oe, 2,220 Oe, 2,518 Oe, 3,475 Oe, 3,998 Oe, 4,623 Oe, and 5,091 Oe, respectively. For each panel, the left column shows the original Fresnel image, the middle column marks the positions of magnetic domain reversal (MDR), and the right column presents the corresponding schematic diagram. Orange and blue regions represent magnetic domains with magnetization directions antiparallel and parallel to the applied field, respectively. All micrographs share the same scale bar.





