




fig3
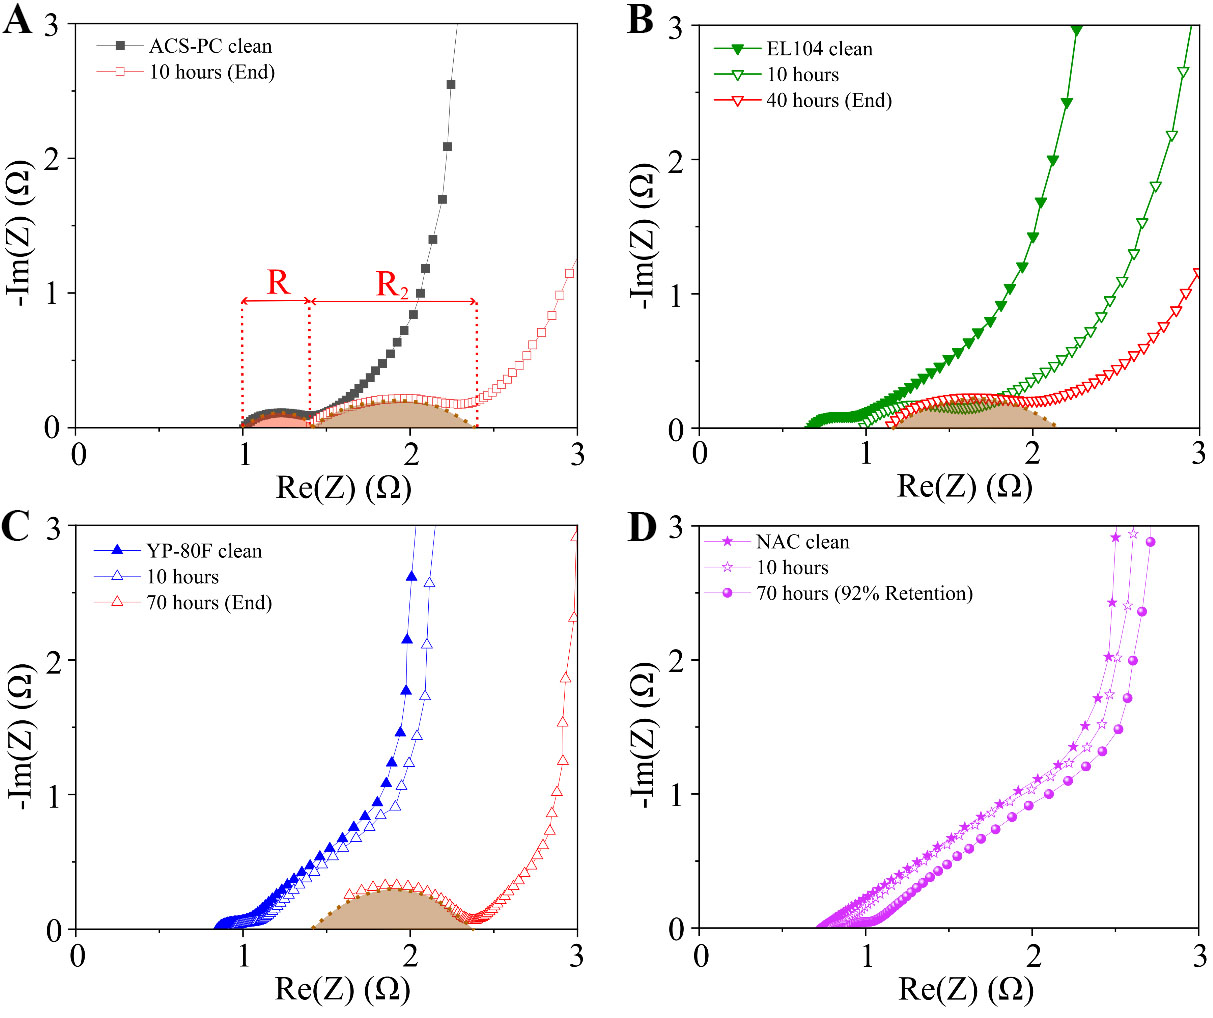
Figure 3. Nyquist plot comparisons reveal compromised high-frequency response, especially in micropore-dominant carbons. (A-C) Nyquist plot comparisons for ACS-PC, EL104, and YP-80F respectively. After 10 h of testing, ACS-PC’s Nyquist plots showed a prominent growth of the high-frequency semicircle region. R and R2 represent the derived Raccess values from equivalent circuit modelling, before and after aging. Similarly, EL104 and YP-80F exhibited prominent increases in Raccess at later time frames; (D) Nyquist plot array for NAC: The clean and 10-h Nyquist plots were selected to compare its behavior to all commercial carbons, while the Nyquist plot at the 70-h mark was chosen to benchmark against that of YP-80F specifically. After 70 h of testing, NAC retained 92% capacitance, and unlike the other carbons, NAC’s Nyquist plots had a significantly smaller high-frequency semicircle. NAC: Nanoporous amorphous carbon.





