




fig4
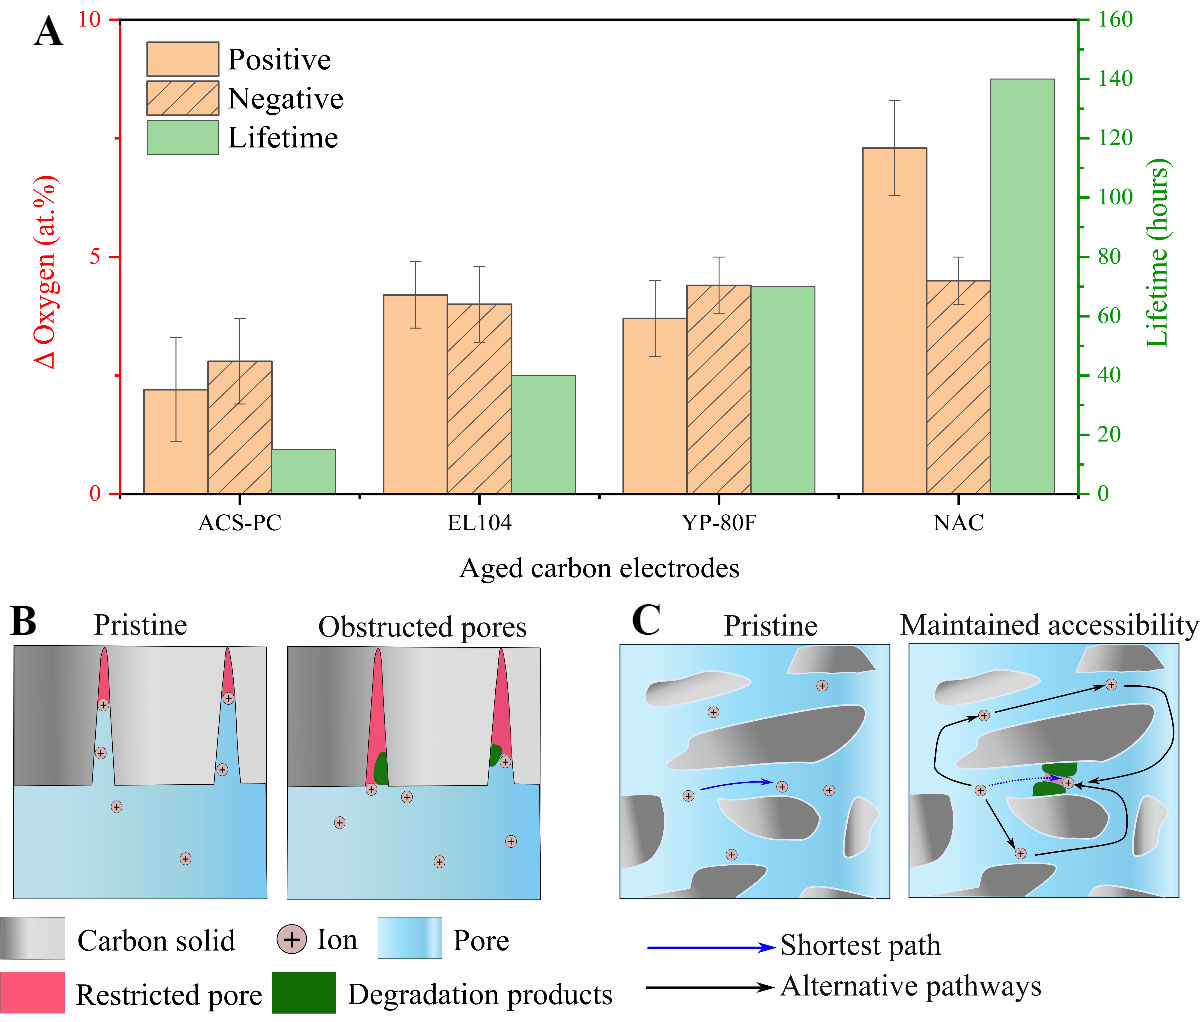
Figure 4. Post-mortem analyses and schematic discussion of degradation tolerance. (A) EDS analyses of aged carbon electrodes to elucidate the changes in oxygen composition of the electrode after attaining End-of-Life (defined by 20% capacitance loss). Each carbon is also plotted against its lifetime. For the chart derived via EDS analyses, the error bars correspond to one standard deviation and represent the variability in composition within each aged electrode. Five spots were measured per electrode; (B) Schematic of premature pore occlusion inside micropore-rich structures with terminal branches. Local obstructions at pore entrances lead to a loss of ion accessibility; (C) Schematic of mitigated pore blocking within well-interconnected pore structures. Despite the accumulation of by-products, alternative pathways allow ions to migrate across the structure, leading to mitigated capacitive loss and subsequently enhanced cycling lifetime. EDS: Energy-dispersive X-ray spectroscopy.





