


fig3
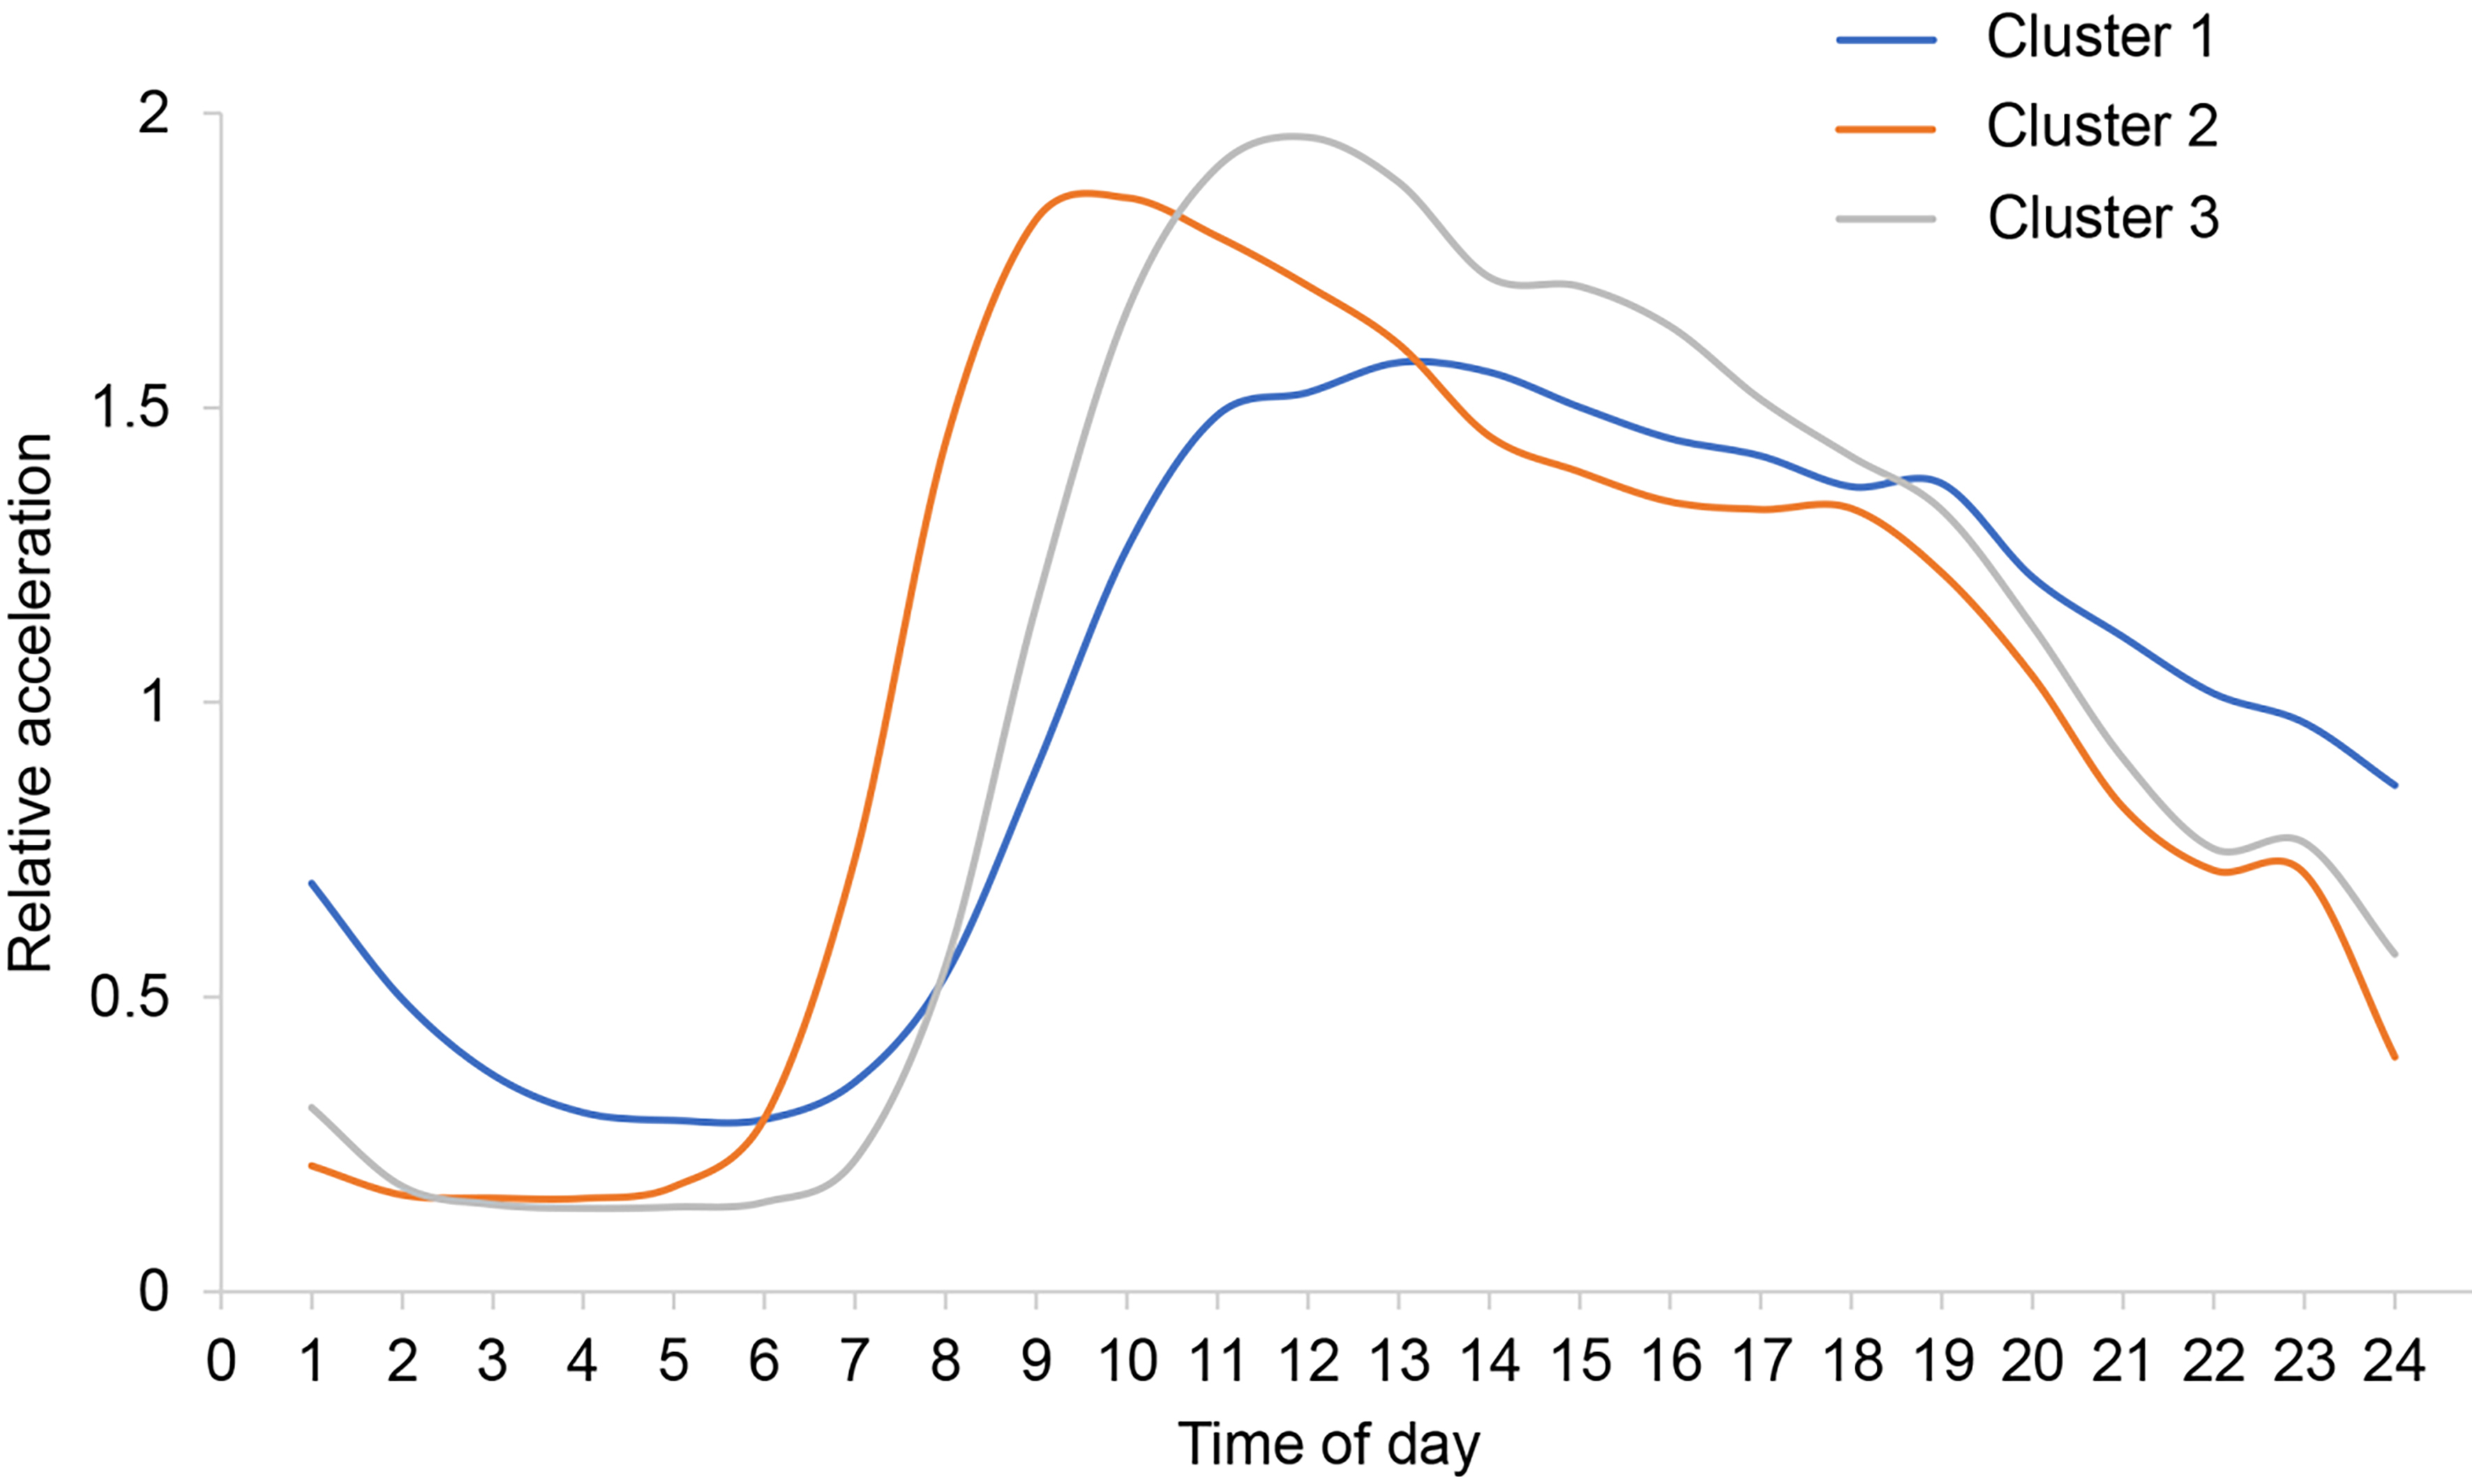
Figure 3. Clusters of relative acceleration patterns. The relative acceleration was calculated by dividing each hourly acceleration mean by each individual total day acceleration mean (adjusted for non-wear time bias). Cluster 1: A relatively uniform distribution of physical activity intensity during the day; Cluster 2: physical activity peak at around 8-9 a.m. daily; Cluster 3: physical activity peak at around 11-12 a.m. daily.


