


fig5
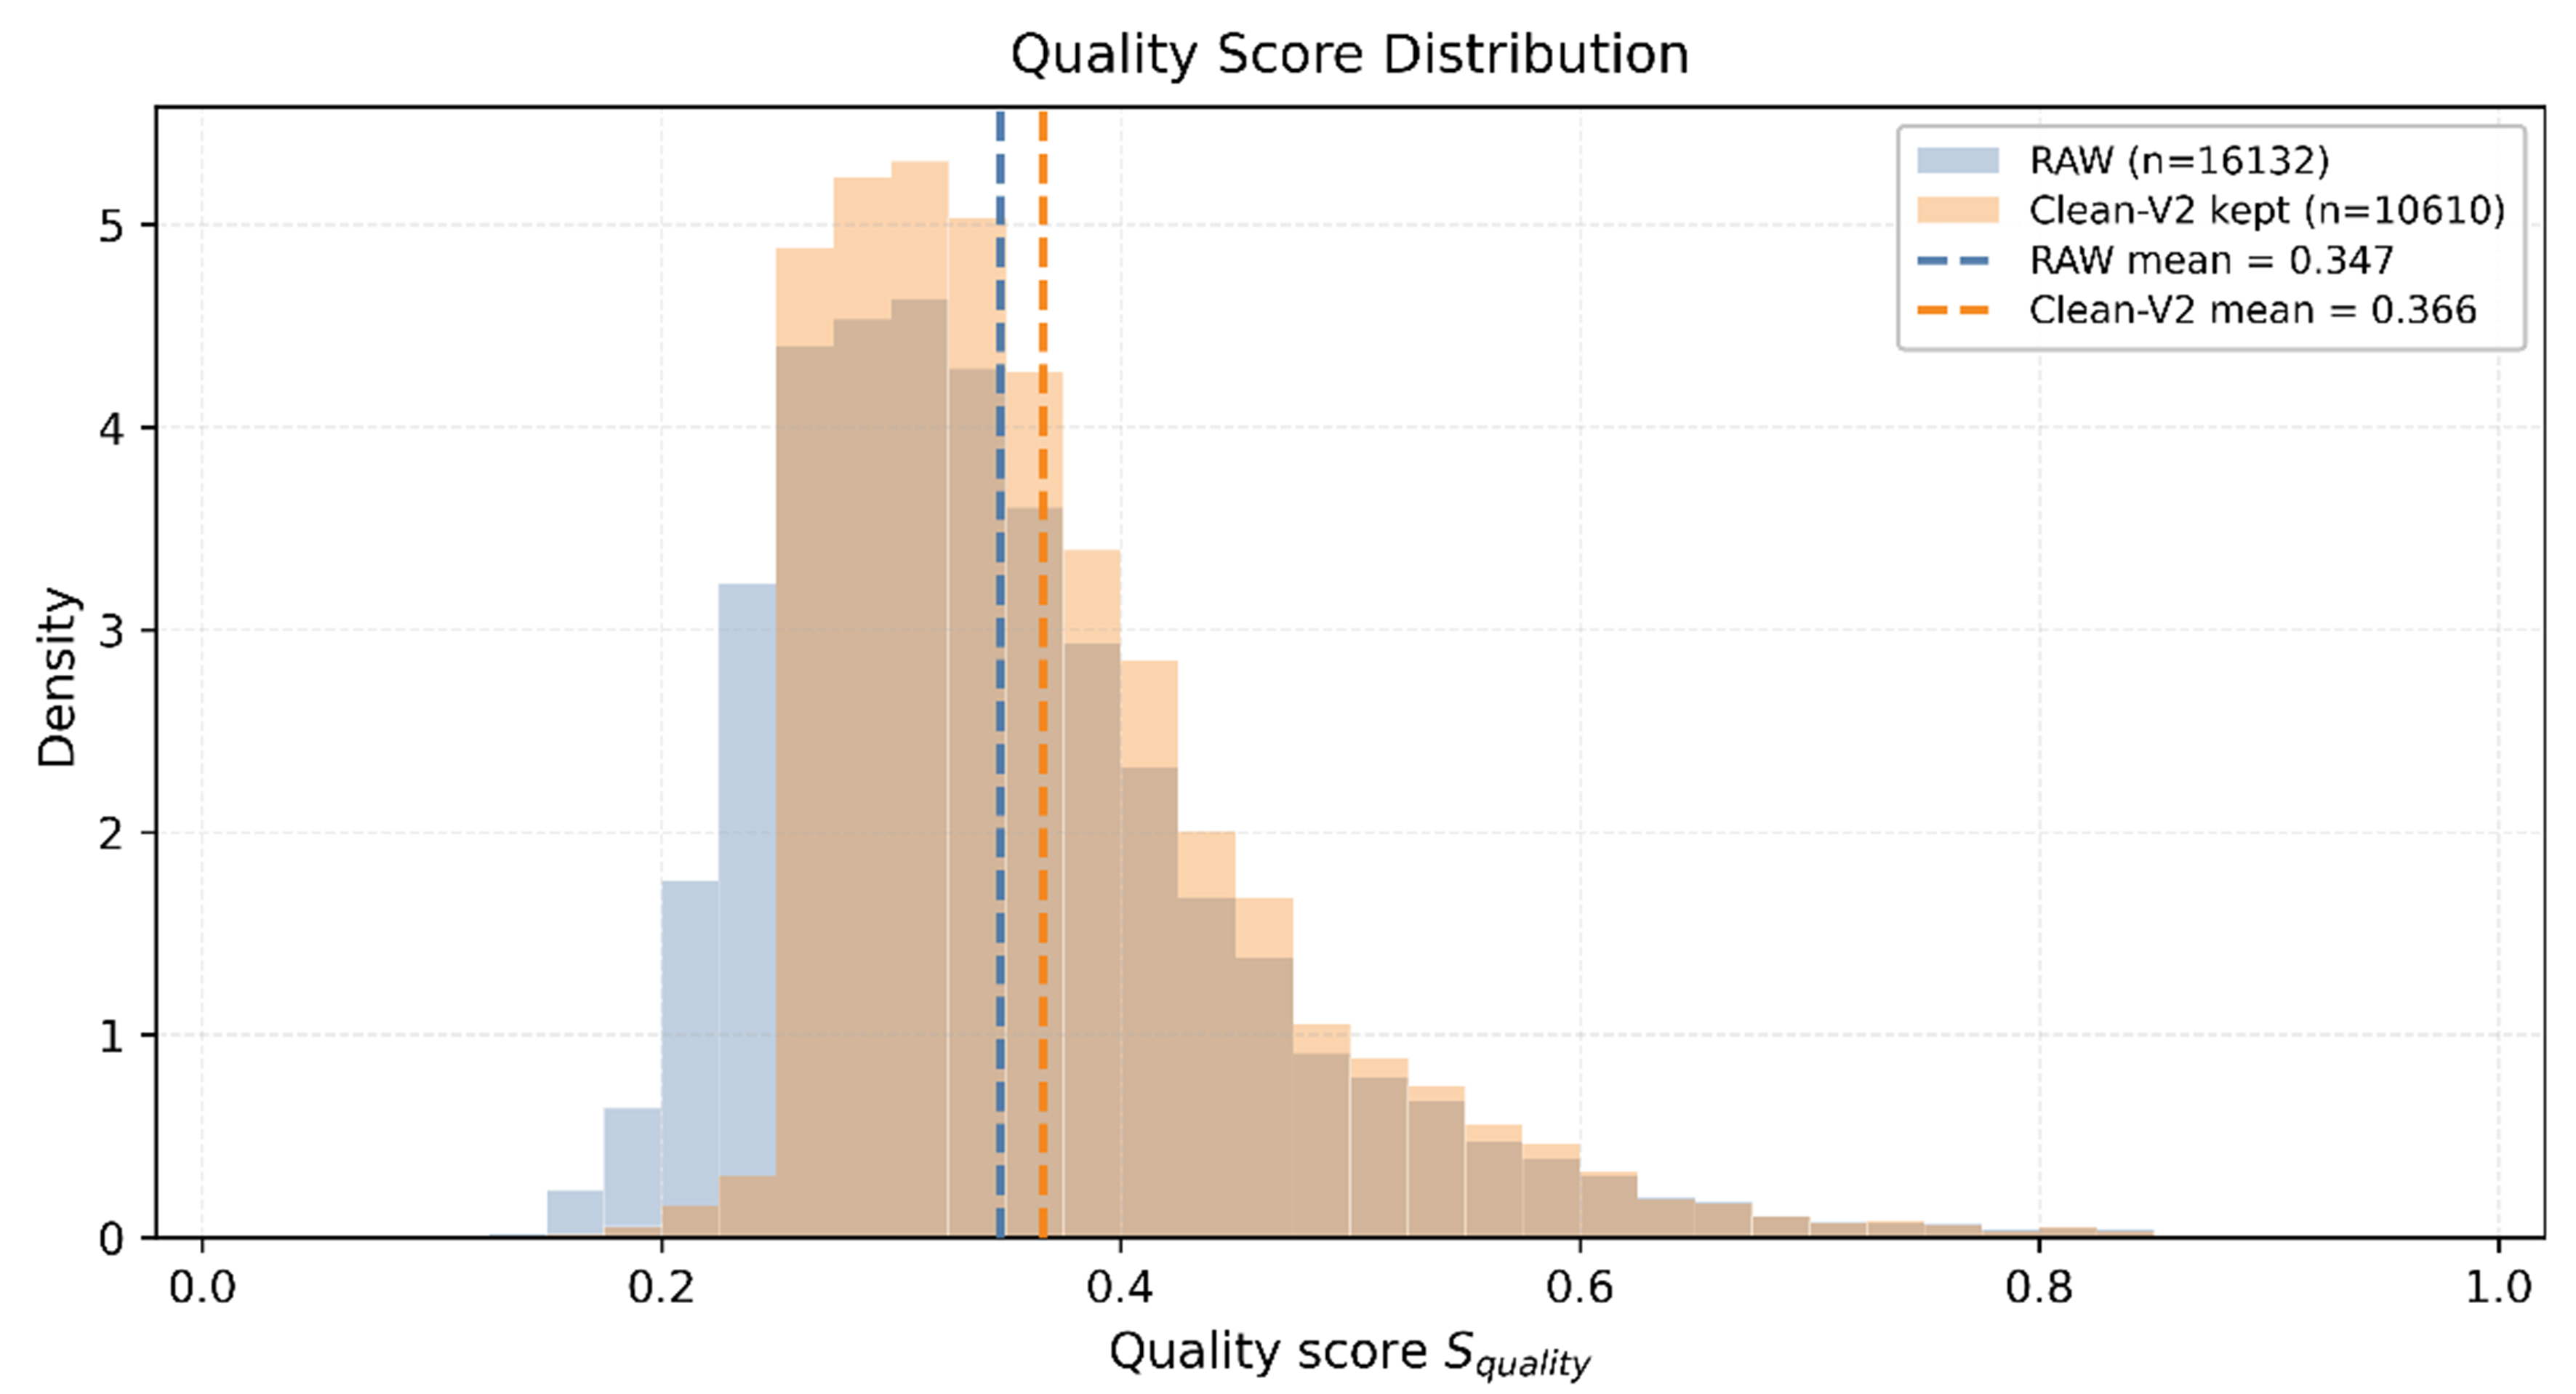
Figure 5. Quality score distribution comparison between RAW and Clean-V2 training sets. Dashed vertical lines indicate the mean quality scores of the two sets. RAW grade ratio: C = 50.0%, B = 30.0%, A = 20.0%.
Figure 5. Quality score distribution comparison between RAW and Clean-V2 training sets. Dashed vertical lines indicate the mean quality scores of the two sets. RAW grade ratio: C = 50.0%, B = 30.0%, A = 20.0%.


All published articles are preserved here permanently:
https://www.portico.org/publishers/oae/


