


Quality-driven unsupervised data curation and robust learning method for bird image data
 0
0 Abstract
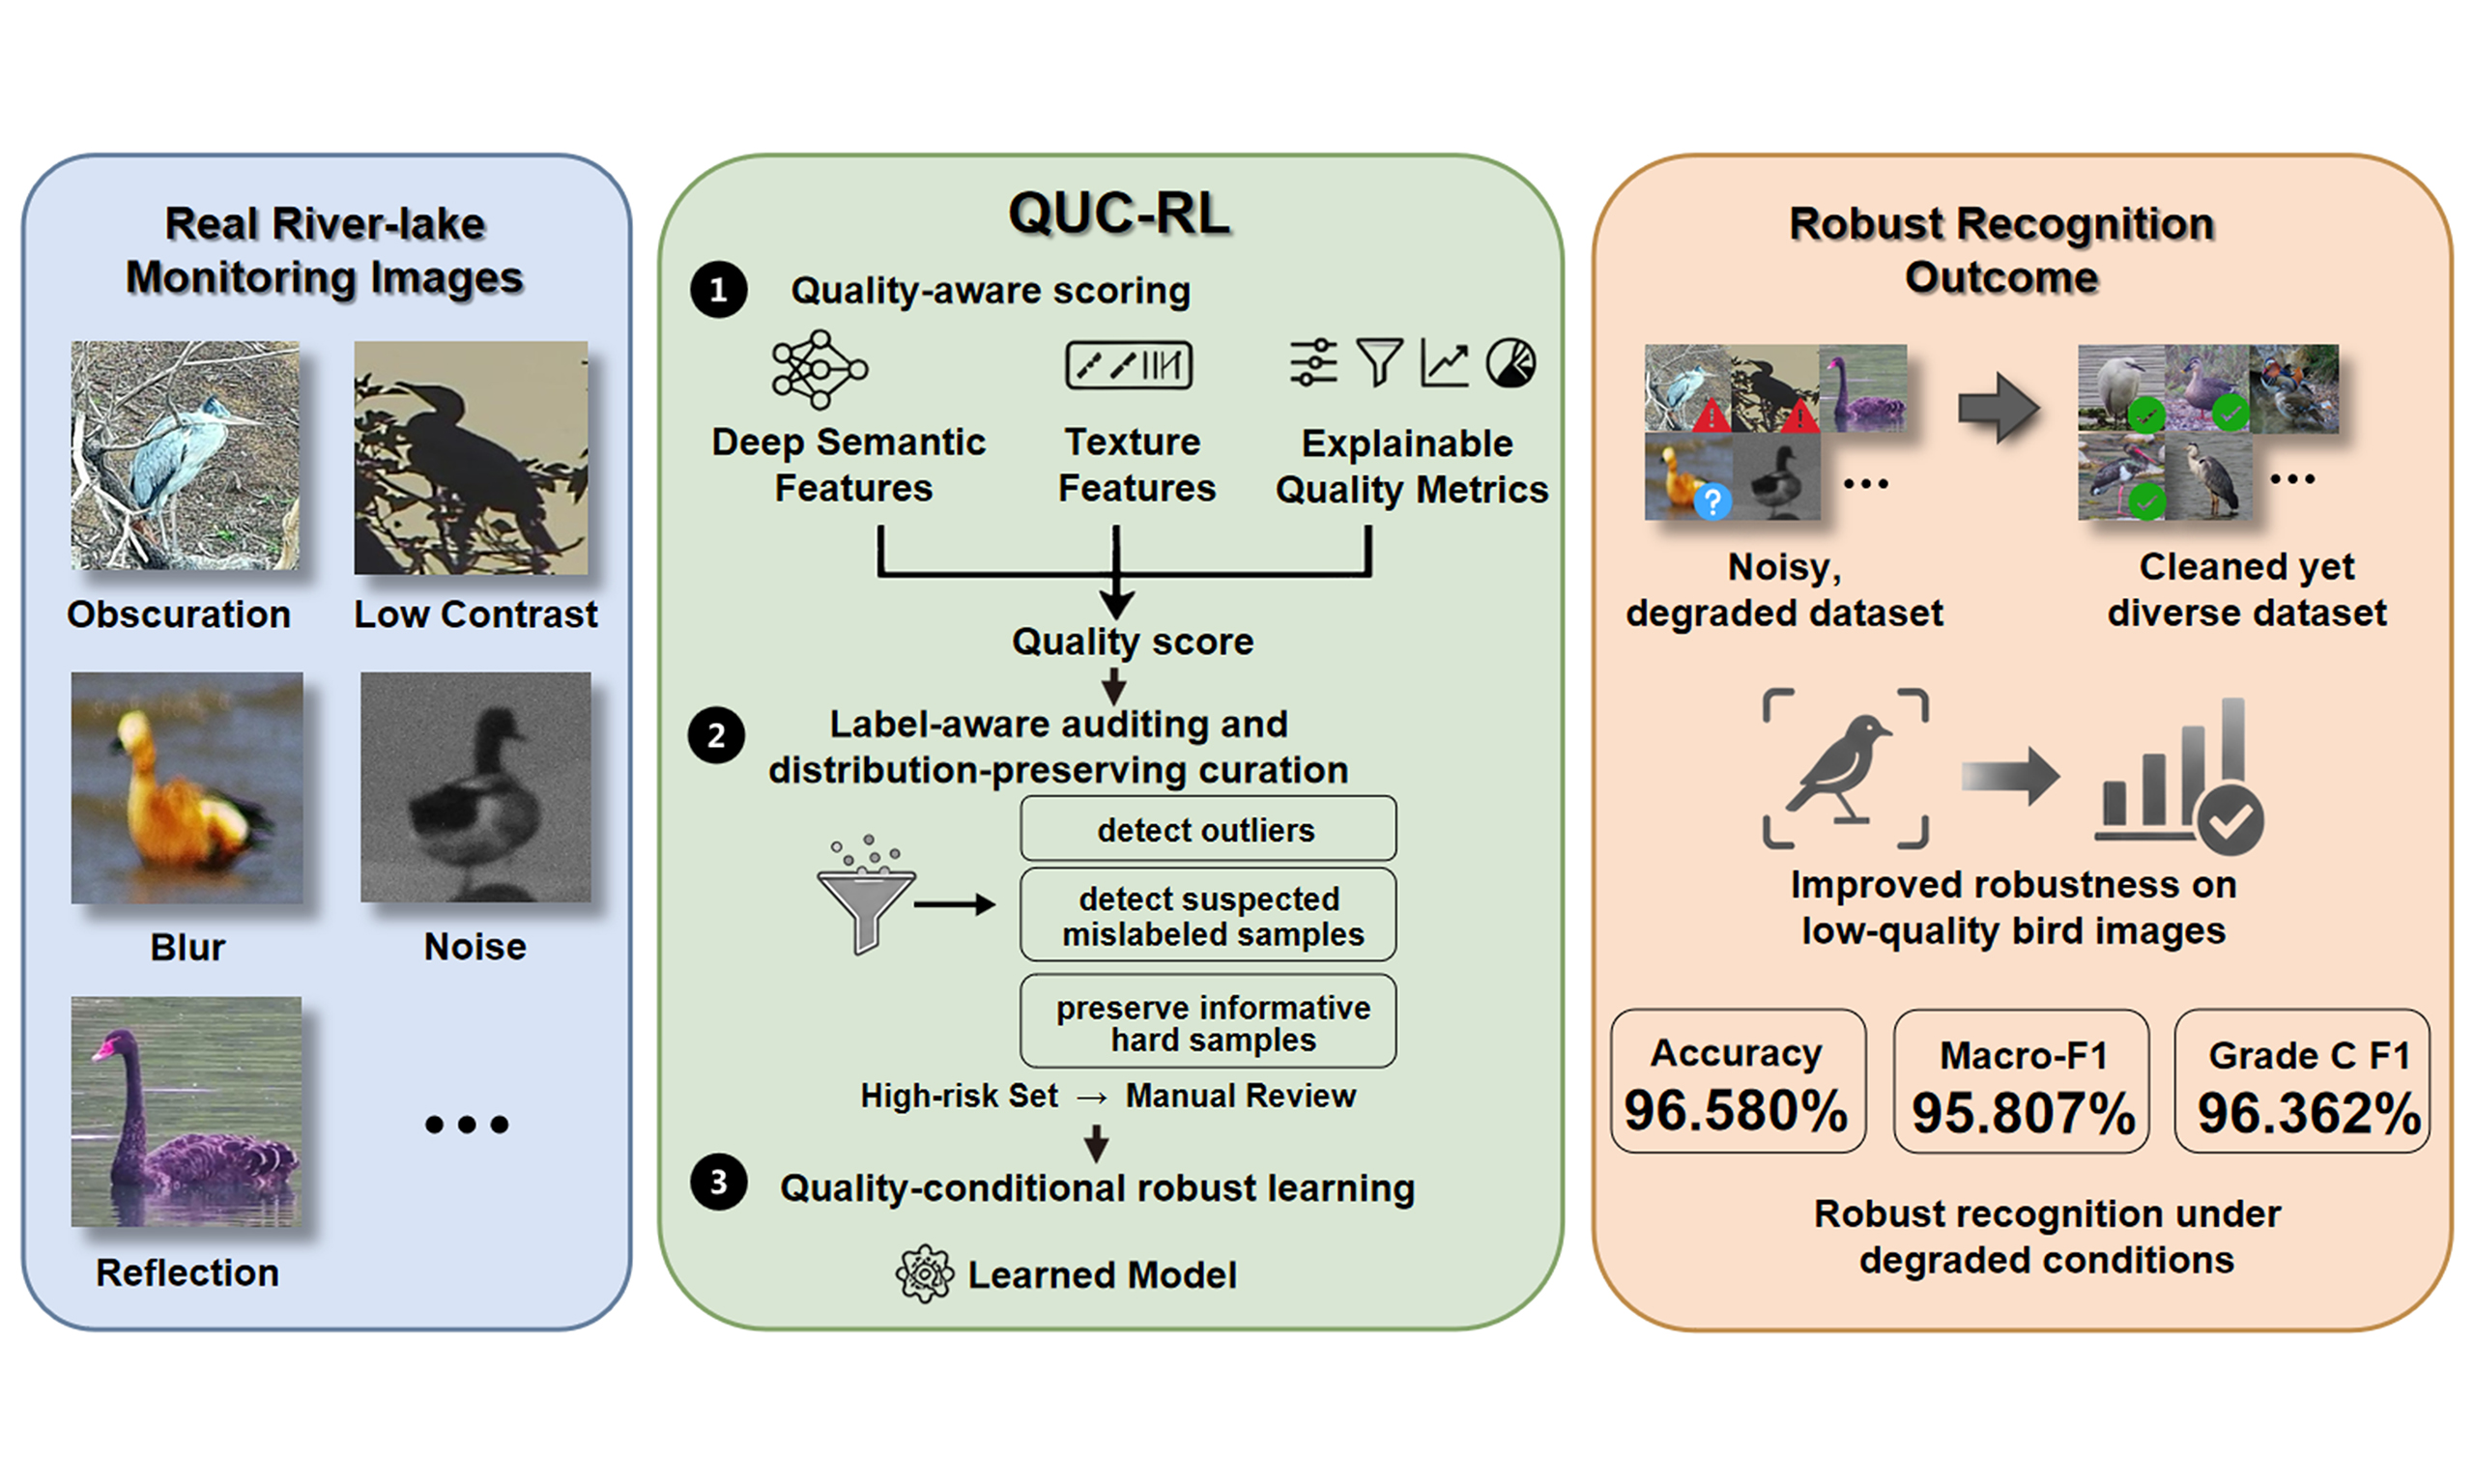
Data acquisition for river-lake avian species suffers from interference by long-distance imaging, water surface reflections and occlusions, producing low-quality images with motion blur, low contrast and annotation noise. Such defects severely degrade the accuracy of classification models. To address this problem, this paper proposes a processing algorithm for low-quality river-lake bird image data, termed the quality-driven unsupervised data curation and robust learning (QUC-RL) Method. The algorithm is divided into four key modules: First, a multi-dimensional quality-aware representation space for bird image data is constructed by fusing deep semantic features, texture features and four interpretable quality metrics, based on which a quality score is derived. Second, multi-strategy unsupervised auditing and curation for outlier and mislabelled sample localization is implemented with the constructed multi-strategy cluster selection mechanism. Third, the dataset is preliminarily reconstructed via an adaptive distribution preservation strategy based on the obtained quality scores and localization results. Finally, hard subsets within the reconstructed dataset are enhanced by a quality-conditional robust learning framework. Experimental results demonstrate that the overall performance is preserved and the stability of macro-average performance on low-quality subsets is improved, while the dataset scale is reduced by the proposed QUC-RL method. Classification accuracies of 96.580%, a Macro-F1 of 95.807% and a Grade C F1 of 96.362% are achieved by models trained on the reconstructed dataset.
Keywords
1. INTRODUCTION
Riverine and lacustrine wetland birds serve as pivotal indicator species for aquatic ecosystem monitoring and assessment. Their presence not only reflects the health of riverine and lacustrine ecosystems but also holds significant implications for the integrity and stability of their respective food chains[1]. Historically, avian monitoring relied primarily on traditional manual survey methods such as point sampling and transect surveys. These approaches are time-consuming, labour-intensive, have limited coverage, and are highly dependent on specialised identification personnel. Consequently, with the increasing demands of ecological conservation, there is an urgent need to integrate intelligent technologies to achieve automated and refined monitoring of river-lake birds[2,3].
Currently, with the rapid advancement of artificial intelligence technologies, computer vision-based automated bird monitoring has emerged as a core research focus within the fields of smart water management and ecological conservation. For instance, Zhang et al. employed dome cameras and deep learning techniques to conduct long-term continuous observations of waterbird communities, significantly advancing the automation of ecological monitoring[4]. Wu et al. proposed a deep learning-based video monitoring framework, achieving efficient identification and density estimation of migratory waterbirds in complex wetland environments, thereby markedly enhancing monitoring efficiency and stability[5]. To accurately obtain core information such as bird species, numbers, and distribution, avian recognition research has gradually become a key focus in this field in recent years, yielding relatively fruitful results. For instance, Chalmers et al. applied the Faster R-CNN architecture to real-time classification of camera trap images, effectively reducing misclassifications and manual labour while demonstrating deep learning’s potential for automated bird recognition[6]. Mulero-Pérez et al. proposed a federated learning-based distributed bird recognition framework, enabling local model training on edge devices to overcome data transmission constraints in remote wetlands[7]. Beyond core intelligent monitoring techniques like bird detection and recognition, enhancing algorithmic generalisation capabilities represents a significant current research direction. For instance, Oba and Doi demonstrated that deep metric learning improves cross-domain generalisation for ecological imagery, providing a universal feature space for ecological monitoring[8].
Although the aforementioned algorithms have demonstrated favourable application outcomes in automated bird monitoring tasks, their performance generally relies on high-quality bird datasets. The quality of these datasets directly impacts the accuracy of model detection and recognition. For instance, the CUB-200-2011 dataset[9] is a typical example. Regrettably, unlike existing high-quality datasets featuring prominent bird subjects and high image clarity, real-world river-lake monitoring scenarios exhibit extreme complexity, primarily manifested in three aspects: (1) The detection capabilities of sensors such as cameras are inherently limited, making it difficult to obtain high-precision monitoring information from distant water areas; (2) Interference factors such as water surface reflections, high-speed bird movements, and complex background occlusions frequently result in severe motion blur, low contrast, and imaging noise in captured images; (3) The identification of fine-grained features such as feather textures and morphologies presents considerable difficulty. Existing automated data collection systems are highly prone to generating labelling noise and outlier samples, further compromising dataset quality. Addressing these challenges, current research mainly follows two complementary directions: model-centric optimisation for degraded bird recognition scenes and data-centric governance for low-quality training data.
The first direction focuses on model-centric optimisation for degraded monitoring scenes and fine-grained recognition. In the field of bird detection and recognition within riverine and lacustrine wetland environments, research has predominantly focused on adapting network architectures to degraded scenes. Ma et al. optimised bird detection in Poyang Lake videos using an enhanced YOLOv8 approach, effectively addressing complex background interference[10]. Fang et al. proposed the Birds-YOLO model tailored for the Dongting Lake environment, leveraging YOLOv11 to enhance detection capabilities for small targets[11]. Huang et al. proposed a lightweight waterbird recognition framework for complex wetland backgrounds, balancing accuracy and efficiency in challenging scenarios[12]. While these approaches enhance performance through deeper networks or attention mechanisms, they lack systematic solutions for addressing long-tail quality distributions, outliers, and potential mislabelling in training data. This limits robust generalisation across low-quality domains. In practical applications, training datasets are often saturated with low-quality samples. Direct utilisation of such data risks models learning erroneous feature representations. Within the Fine-Grained Visual Classification (FGVC) domain, researchers strive to achieve high-precision detection or recognition outcomes by extracting discriminative local features. Mainstream approaches such as TransFG[13] utilise Transformers to capture long-range dependencies, while PMG[14] employs multi-scale jigsaw puzzles to compel models to focus on local details. However, these methods typically assume input images possess high signal-to-noise ratios and clear textural details. When confronted with the blurred or low-resolution images prevalent in river-lake monitoring, the loss of high-frequency texture information causes significant performance degradation in these fine-feature-dependent models[15]. Nevertheless, most of this work focuses on model-centric optimisation, assuming the training data distribution is fixed.
The second direction shifts attention from model architecture to the quality of the training data itself. With the emergence of data-centric AI concepts[16], researchers have begun addressing the inherent quality of data itself. Regarding noisy data governance, Song et al. systematically reviewed noisy label learning methods for deep neural networks[17]. Northcutt et al.’s Confident Learning framework employs joint distribution matrix estimation for label correction, providing theoretical foundations for large-scale data governance[18]. Feuer et al. further emphasised the decisive impact of large-scale data filtering strategies on model performance in their latest SELECT benchmark[19]. However, existing data cleaning methods face a core contradiction when processing riverine and lacustrine avian data: while robust cleaning removes noise, it often erroneously discards low-quality hard samples possessing high discriminative value. Recent research by Drenkow and Unberath confirms a direct causal relationship between image quality metrics and deep network robustness[20]. Cleaning that disregards the quality dimension causes the training data distribution to collapse towards simpler samples (distribution shift), resulting in models lacking robustness when deployed under adverse conditions. Liu et al. emphasise in their review that future FGVC initiatives must integrate data quality modelling with sample-level filtering mechanisms to address long-tail distributions and noise bias[21]. Whilst Zhang et al.’s Q-Norm proposes learning robust representations through quality-adaptive normalisation, explicitly preserving and utilising low-quality samples during data governance remains an unresolved challenge[22]. Beyond data-level governance and model-centric optimisation, image restoration technology has emerged as a critical approach to mitigate environmental degradations directly. For instance, advanced architectures such as PH-Mamba have demonstrated significant potential in recovering fine details from rain-streaked images[23]. Similarly, multi-axis feature diversity enhancement has been effectively applied to remote sensing video super-resolution[24]. Meanwhile, progressive real-time image deraining methods[25] demonstrate the potential of image restoration to mitigate environmental degradation before classification. Furthermore, existing augmentation strategies typically treat all samples uniformly, lacking adaptability to the long-tailed quality distribution within datasets[26,27].
In summary, the core challenges in current river-lake avian monitoring lie in how to effectively purify low-quality noisy data under unsupervised conditions, avoid destroying the distribution characteristics of hard samples during data cleansing, and implement robustness optimisation for low-quality data domains. To this end, this paper proposes a quality-driven unsupervised data curation and robust learning (QUC-RL) method. Distinct from existing methods that treat data curation and model training as isolated pipelines, the proposed QUC-RL framework establishes an intrinsic feedback mechanism based on quality distribution. The core of this framework resides in employing quality assessment results to guide subsequent unsupervised auditing and sample retention, thereby ensuring the integrity of the original feature distribution during the data cleansing process. The main contributions are as follows:
(1) We construct a multidimensional quality evaluation space tailored to river-lake bird images. Four interpretable indicators - sharpness, contrast, edge strength, and noise level - are selected to characterise the dominant degradations in this scenario, including motion blur, water-surface reflections, small-target contour loss, and surveillance noise. By combining these cues with semantic and texture features under intra-class normalisation, the framework provides a reliable quality score for subsequent unsupervised data curation.
(2) We develop a label-aware unsupervised auditing module based on multi-strategy cluster selection (MSCS), which performs unsupervised noise detection on labelled bird image data without requiring manual quality or noise annotations. Through a rank-sum mechanism, this module effectively identifies label noise and low-quality outliers, alleviating the robustness limitations of individual clustering algorithms in complex river-lake monitoring scenarios.
(3) We propose an adaptive distribution preservation strategy and a quality-conditional robust learning framework. By utilizing quality scores to mandate the retention of low-quality but correctly annotated samples, the strategy prevents the loss of feature-space representativeness caused by over-cleansing. When combined with the quality-conditional MixUp (QCA-Mix) strategy, this approach enables both dataset reconstruction and targeted performance enhancement for hard subsets.
The remainder of this paper is structured as follows: Section 2 details the methodology of the proposed QUC-RL framework, covering the interpretable quality assessment, unsupervised auditing, and distribution-preserving strategies. Section 3 presents the experimental settings, dataset construction, and comprehensive performance evaluations. Section 4 provides a discussion on the engineering deployment potential and study limitations.
2. METHODS
Addressing prevalent challenges in river-lake monitoring - poor image quality, high annotation noise, and weak model generalisation - this paper introduces the QUC-RL algorithm. In this study, “unsupervised curation” in QUC-RL refers to label-aware unsupervised auditing, namely unsupervised noise detection on labelled bird image data without manual quality-grade labels or manually annotated noisy/outlier labels. The available species labels are used only for intra-class normalisation, label-consistency verification, and class-preserving reconstruction. As illustrated in Figure 1, the overall architecture is organized into four tightly coupled blocks. Block 1, the Quality Score Calculation Scheme, constructs a unified feature space that integrates semantic features, textural features, and interpretable quality metrics, while alleviating species bias through intra-class normalisation. Block 2, Multi-Strategy Unsupervised Auditing and Curation, adopts the MSCS mechanism to search for an appropriate clustering structure and then identifies outliers and suspected mislabelled samples with robust statistical criteria. Block 3, the Adaptive Distribution Preservation Strategy, selects the cleaning intensity via utility-driven threshold scanning and removes noise while retaining category coverage and difficult low-quality samples through the class-floor and Bottom-Q mechanisms. Block 4, Quality-Conditional Robust Learning, performs targeted Mixup augmentation on the challenging subset to improve generalisation under real-world degradation. In this way, the four blocks form a coherent pipeline from quality assessment to data curation, reconstruction, and robust learning.
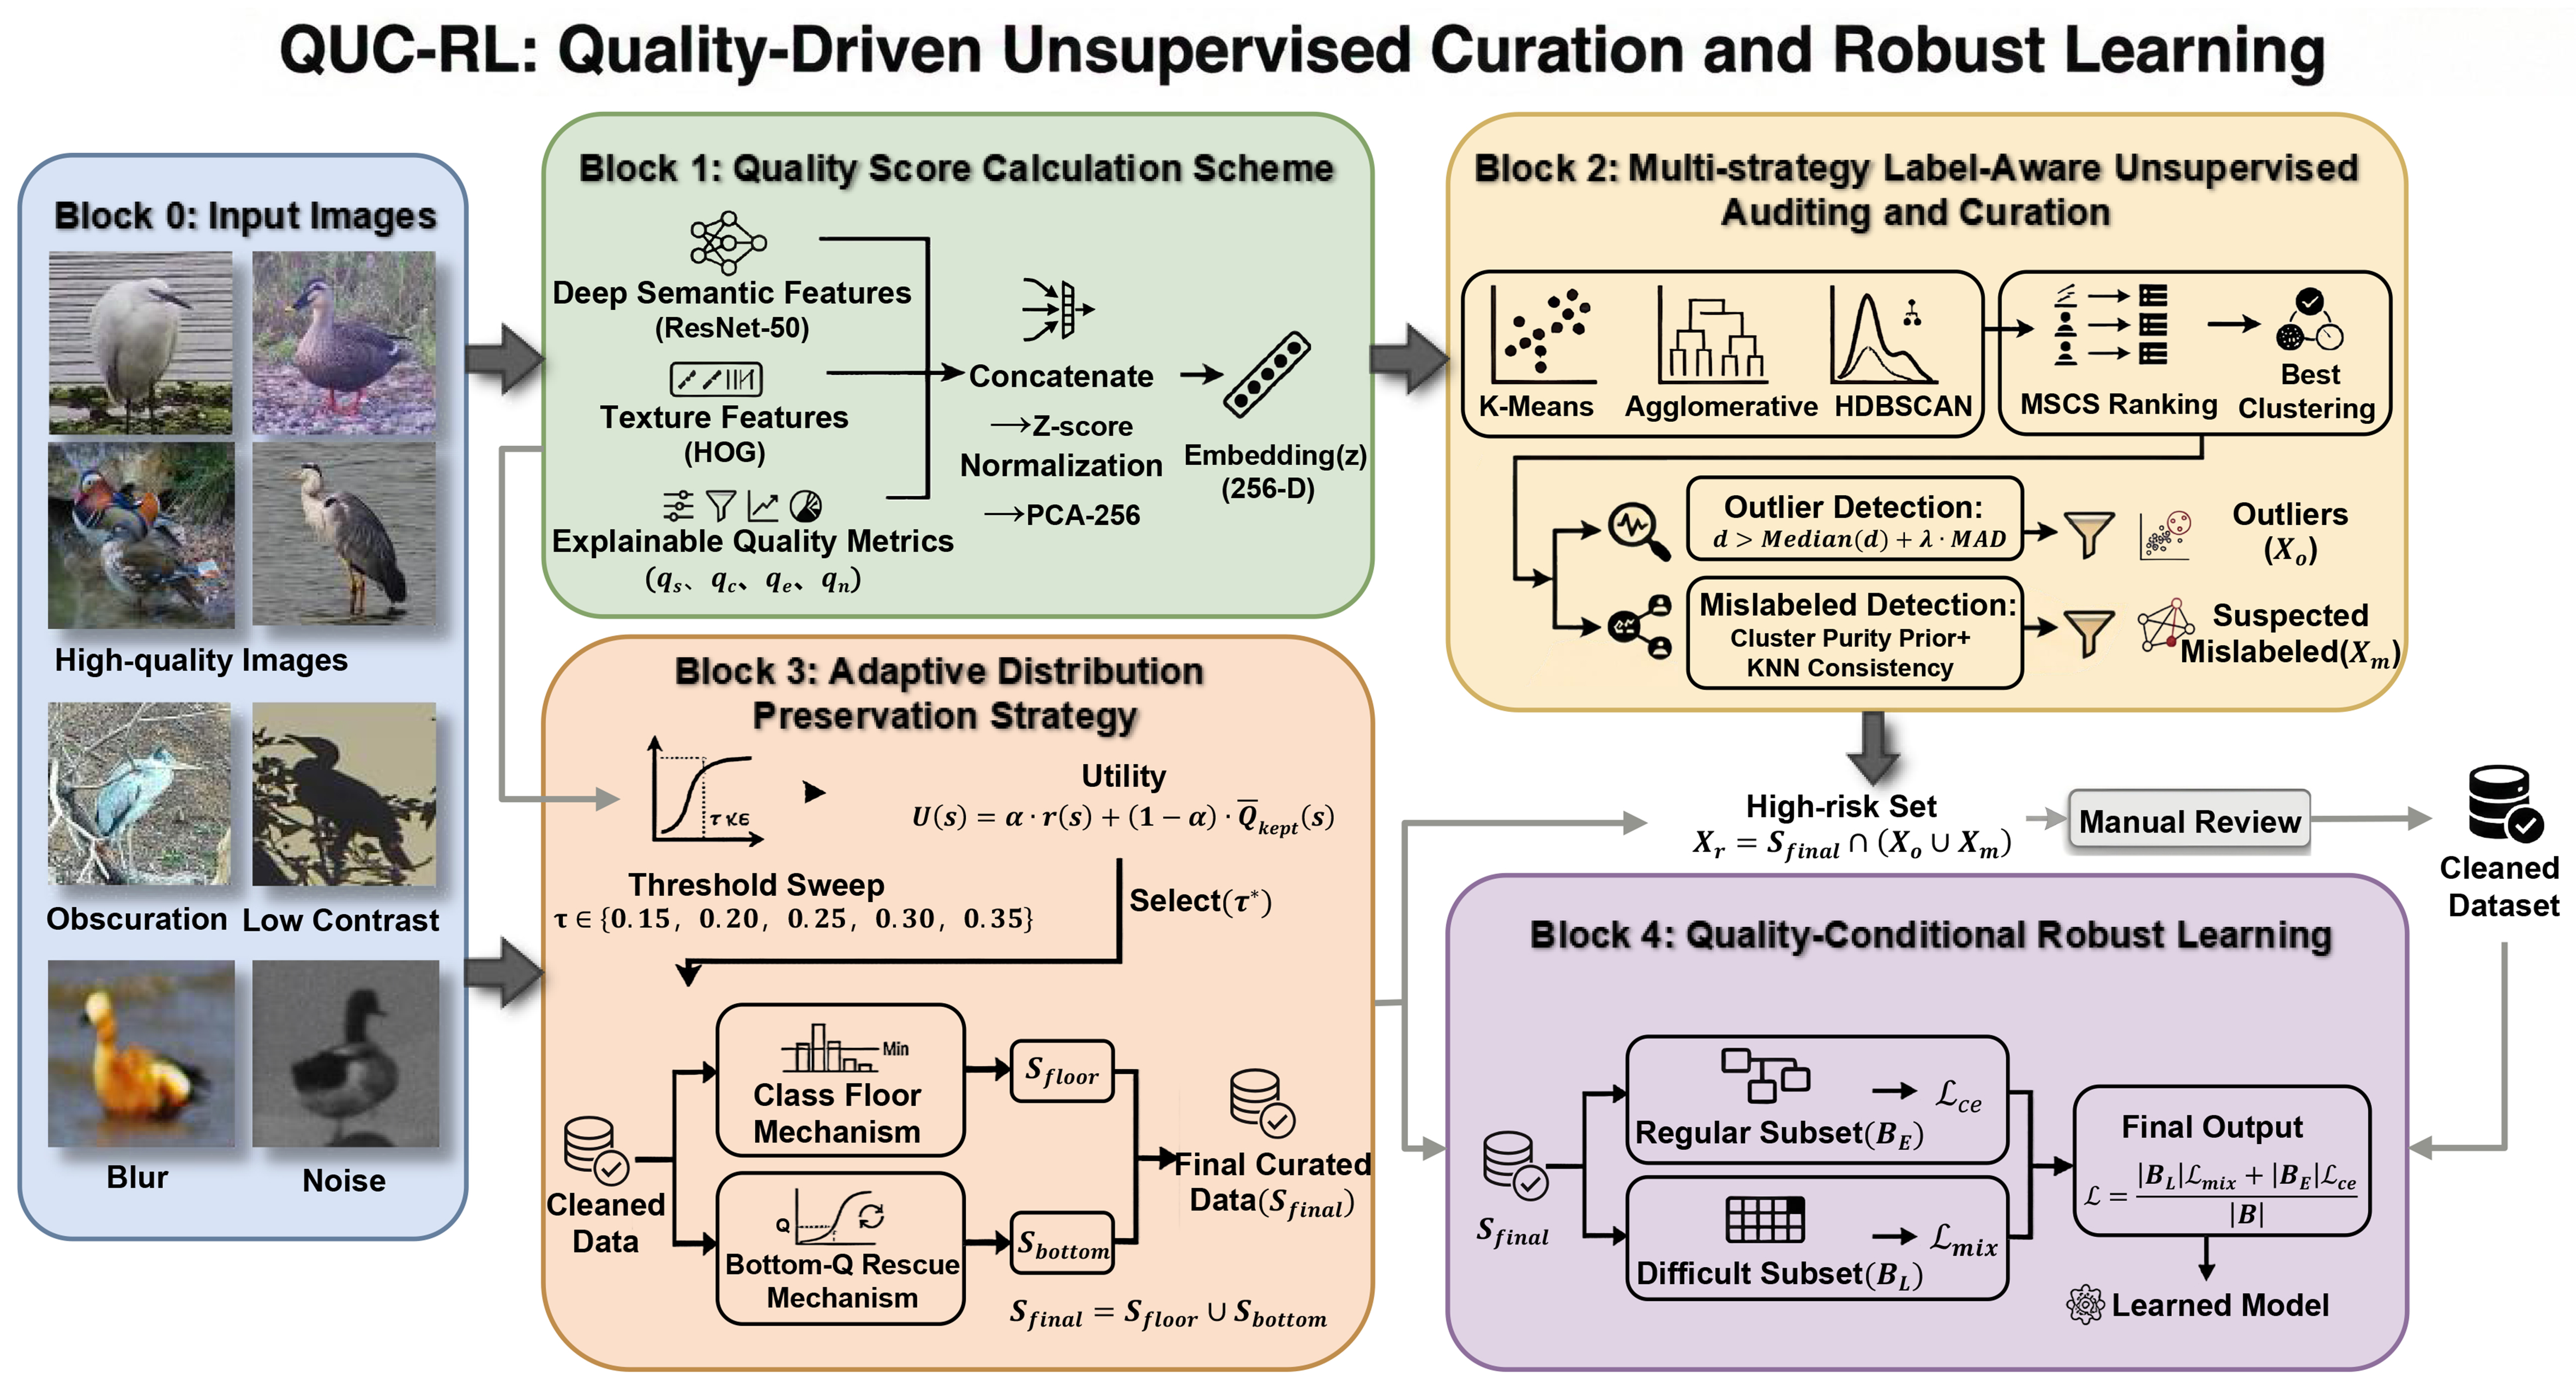
Figure 1. The overall QUC-RL architecture. The functional elements used in the diagram were created using resources from iconfont for academic illustration purposes. Photographs are from the authors’ research project and are reproduced with permission. QUC-RL: Quality-driven unsupervised data curation and robust learning.
2.1. Quality score calculation scheme based on multi-dimensional quality-aware representation space
River-lake surveillance imagery, influenced by shooting distance and environmental conditions, commonly exhibits motion blur, low contrast, and imaging noise. Furthermore, different bird species possess inherent variations in texture and colouration. Relying solely on deep semantic features proves insufficient for distinguishing low-quality samples from noisy ones. Therefore, considering the complementary expressive advantages of multimodal feature fusion and the effectiveness of intra-class normalisation in mitigating species bias, this paper constructs a multi-dimensional feature space encompassing semantic, textural, and visual quality to quantify sample value in the absence of manual fine-grained quality annotations. This space is defined by the following components Z. The above design is closely tailored to the river-lake monitoring scenario. Specifically:
(1) Image sharpness is introduced because long-distance imaging and fast motion frequently cause motion blur and suppress the high-frequency feather details that are critical for fine-grained bird recognition.
(2) Contrast is included to reflect target saliency degradation under water-surface reflections, illumination fluctuation, and cluttered wetland backgrounds.
(3) Edge strength is used because many monitoring images contain small or partially occluded birds, for which contour and local texture cues are more informative than global appearance alone.
(4) Noise estimation is further incorporated to characterise sensor noise and compression artefacts that commonly occur in remote surveillance streams.
Based on this, the intra-class normalisation is adopted to mitigate species-induced bias in quality scores caused by inherent natural differences among different bird species in plumage coloration, body contrast, and texture density, thereby avoiding the erroneous classification of inherent interspecies appearance differences as image quality degradation.
Assuming the original sample image is I , its final representation is:
Where q(I) represents the interpretable quality vector, explicitly encoding the image’s degradation level; fdeep denotes the deep semantic features extracted by ResNet50, capturing species-discriminative characteristics; fhog signifies texture features, supplementing edge contour information prone to loss in blurred images; Φ(·) denotes the concatenation, standardisation, and dimensionality reduction mapping. Specifically, the process of Φ(·) is implemented as follows. Let the semantic feature, texture feature, and quality vector of sample i be denoted by fi∈ℝ2048, gi∈ℝ128, and qi∈ℝ4, respectively. The fused feature before compression is defined as:
After Z-score standardisation, principal component analysis (PCA)[28] is applied to obtain the final embedding:
Where P denotes the PCA projection matrix.
Here, the Laplacian variance[29] is employed to measure the sharpness (qs) of high-frequency details reflecting motion blur, calculated as:
The contrast (qc)[30] reflecting illumination conditions and target prominence is calculated as:
Edge strength (qe), representing the richness of fine-grained information such as feather texture and contours, is obtained based on the mean of Sobel gradient magnitudes[31]:
Noise level (qn) in avian images, obtained via median absolute deviation (MAD) robust estimation[32] based on Gaussian-smoothed residuals:
Furthermore, distinct bird species exhibit inherent variations in colour and texture, such as the black cormorant and white egret. Direct global normalisation may result in systematic under-scoring for certain categories, causing them to be excessively weakened during cleaning and leading to severe imbalance in data sample quality. To address this, a category-aware normalisation strategy is adopted to reduce inter-category bias, consistent with the long-tailed recognition motivation in[33]. Specifically, intra-class min-max normalisation is implemented as follows. For a sample x within the bird category c, its normalisation metric is defined as:
Among these, x∈Xc, Xc
The quality assessment sets the fusion weights ω = [ωs, ωc, ωe, ωn]. We adopt a weighted scheme guided by the dominant degradations in the actual monitoring and their impact on fine-grained cues. In general, sharpness is assigned the highest importance because motion blur and long-distance imaging strongly suppress high-frequency details critical for discrimination. Contrast and edge strength are treated as comparably important as they jointly reflect target saliency and local structural cues under reflections and cluttered backgrounds. Noise is given a relatively smaller importance since it is estimated robustly and is often partially correlated with sharpness and edge degradations, where overweighting may introduce redundancy. This setting is therefore used as a task-driven default rather than an exhaustively tuned hyperparameter.
For interpretability and subsequent stratified evaluation, Squality is mapped to graded labels, with quality scores partitioned into three tiers - Grade A, Grade B, and Grade C - based on quantiles. These discrete grading thresholds are used only to define a statistically stable low-quality subset for robustness evaluation. The training process itself is driven by continuous quality scores and is therefore independent of the specific grade boundaries.
2.2. Multi-strategy label-aware unsupervised auditing and curation for outlier and mislabelled sample localization
When identifying noise within the complex feature space of bird images, single clustering algorithms often exhibit high parameter sensitivity and weak generalisation capabilities. Furthermore, the presence of outliers and mislabelled samples co-distributed within the dataset makes it challenging to adapt to diverse cluster structures across different datasets. Therefore, this paper leverages the advantages of multi-strategy integration in reducing uncertainty and the reliability of local consistency checks for error correction. We perform unsupervised clustering in the embedding space Z, constructing an unsupervised auditing and noise cleansing mechanism based on MSCS. By automatically selecting the optimal clustering structure and combining robust statistics, we achieve precise identification of high-risk samples under unsupervised conditions.
Deep semantic features fdeep∈ℝ2048 of avian image samples constitute high-level semantic information, enhancing the algorithm’s category discrimination capability. Histogram of oriented gradients (HOG) vectors fhog represent traditional texture characteristics of local texture and directional gradient distribution, excelling in identifying objects with distinct contour edges. The acquired quality feature vectors
Clearly, this representation z both preserves species semantic structure and incorporates interpretable quality factors, providing a stable metric foundation for subsequent clustering and mislabel detection.
Unsupervised clustering is performed in the embedding space Z corresponding to the feature representation z to uncover the natural structure of samples, with noise identification based on the resulting cluster structure. To achieve an adaptive clustering process, this paper constructs a MSCS module. In river-lake bird data, the embedding topology may vary substantially across species and quality conditions: some categories form relatively compact centroid-like clusters, some exhibit hierarchical similarity due to inter-species appearance resemblance, and heavily degraded or partially occluded samples may appear as sparse noisy regions. To capture the potentially complex and unknown topological structures within the bird image embedding space, we selected K-Means, Agglomerative Clustering, and Hierarchical Density-Based Spatial Clustering of Applications with Noise (HDBSCAN). These algorithms represent the distinct mathematical paradigms of centroid-based, connectivity-based, and density-based clustering, respectively. This integrated approach ensures the framework remains unbiased toward specific distributional assumptions such as spherical clusters, thereby enabling more reliable outlier detection across diverse embedding topologies. For clustering-related settings, the framework does not rely on a single manually fixed clustering result; instead, MSCS compares candidate structures using internal validity indices, which reduces dependence on one clustering parameter configuration.
This module ranks the performance of three unsupervised clustering methods - K-Means, agglomerative hierarchical clustering, and HDBSCAN[34] - using three types of comprehensive metrics: Silhouette, Calinski-Harabasz (CH), and Davies-Bouldin (DB)[35,36]. For each clustering method m, its rank-sum score is defined as:
Where rSil(m), rCH(m), and rDB(m) are the ranks of method m under the Silhouette, CH, and DB metrics, respectively.
It then adaptively selects the most suitable clustering result. Specifically, the use of Silhouette, CH, and DB scores provides a multi-dimensional consensus for cluster validity by balancing intra-cluster cohesion with inter-cluster separation. Among these, the Silhouette metric measures the combined performance of intra-cluster compactness and inter-cluster separation; Calinski–Harabasz favours greater inter-cluster variance and reduced intra-cluster variance; Davies–Bouldin characterises inter-cluster similarity and exhibits heightened sensitivity to excessively fragmented clustering outcomes. To address outlier and mislabelling noise in the dataset, this study incorporates dual detection mechanisms during clustering: adaptive outlier identification based on MAD within clusters, and a “cluster consistency–neighbourhood verification” approach for mislabelling detection. The criteria for classifying a sample as an outlier are as follows:
Here, di denotes the Euclidean distance from the sample i in cluster Cj to the cluster centre, λ = 3.0. MAD is widely employed as a robust metric for constructing resilient thresholds[32]. This threshold adapts to variations in cluster compactness, effectively eliminating atypical samples affected by background clutter or severe occlusion, while demonstrating greater robustness than standard deviation thresholds. Samples satisfying outlier criteria are aggregated into an outlier sample set Xo. For mislabelling noise, semantic pure clusters are first identified using the Cluster Purity Prior. These are clusters where the dominant category proportion Pmajor > τmaj is greater than 0.5 and the difference between dominant and secondary category proportions exceeds τmargin. Subsequently, non-dominant samples within these semantic pure clusters Cj are flagged as candidate mislabelled samples. Finally, the candidate mislabelled samples are subjected to a local consistency check.
For a candidate sample xi, let
Where
Where Ragree denotes the proportion of label consistency among K nearest neighbours. All samples meeting the suspected mislabelled criteria are aggregated into the suspected mislabelled sample set Xm.
2.3. Adaptive distribution preservation strategy
The core dilemma in cleaning the bird dataset lies in the trade-off between noise removal and distribution integrity. Excessively stringent quality thresholds may result in training sets comprising only high-quality samples, inducing distributional bias that causes significant performance degradation when models encounter low-quality inputs during deployment. To address this, this paper leverages the utility function’s advantage in balancing scale and quality, alongside the necessity of the class floor mechanism for preserving long-tail distributions. Consequently, an adaptive distribution-preserving strategy is constructed, yielding final data cleaning results that optimise both sample quantity and quality dimensions.
First, based on the obtained sample quality score Squality, the foundational usable set Sbase is derived. The specific process is as follows: to ensure subsequent threshold sweeps are not dragged down by extremely low-quality samples or introduce significant noise, a hard lower bound on the quality score s is first introduced. A threshold sweep is then performed on s over the candidate set τ = {0.15, 0.20, 0.25, 0.30, 0.35}. Exclude significantly unusable bird images from the sample X from the feasible domain of the optimisation process, yielding the baseline usable set Sbase:
where s is a hyperparameter controlling the threshold for the worst-quality samples, and the number of elements in the baseline usable set Sbase is Nbase.
To mitigate the subjectivity of threshold selection, this paper employs a synthetic utility function for threshold evaluation:
Here, Nkept(s) denotes the number of samples retained at threshold s, r(s) represents the keep ratio, and
Secondly, for the baseline usable set Sbase, utility-maximising truncation is employed to obtain the final retained set Sthresh. The number of elements in Sthresh is Nkept(t), and the average quality score of Nkept(t) is MeanQualitykept(t). The selection of the retained set Sthresh must satisfy the following conditions:
Among these, α = 0.6. This selection criterion is designed to retain as many samples as possible while ensuring quality improvement. To prevent cleaning errors from eliminating challenging samples with high discriminative value for bird recognition in complex river-lake environments, a class floor is employed to stabilise the number of categories. The class floor constrains the number of retained samples per bird category, preventing long-tail categories from being emptied or excessively diluted. When the number of elements in the retention set Stc = Sthresh∩Xc for a bird’s category c falls below Nfloor, samples are replenished from the discarded sample set Xc - Stc, sorted by quality score Squality, to obtain the reconstructed retention sample set Sfc for category c. At this point, the category floor retention sample sets for all bird species are updated to Sfloor, and Stc
Furthermore, for category c, elements of the baseline available set Sbc = Sbase∩Xc are sorted according to Squality. The sample with the lowest quality score Q% is designated as the difficult sample set Sb,qc. Based on this, the Bottom-Q Rescue mechanism constructs the Bottom-Q rescue retained sample set Sb,sc for category c by selecting the top K quality score samples from the difficult sample set Sb,qc. At this stage, the Bottom-Q rescue retained sample set for all birds is Sbottom.
Finally, the retained bird sample set after data cleansing is:
Outliers and suspected mislabelled samples may exist within this set Sfinal. Such samples are grouped into a high-risk sample collection: Xr = Sfinal∩Xo∩Xm. All high-risk samples undergo manual review. This strategy maintains data diversity and prevents overfitting through a dual-pathway mechanism. Specifically, the Category Floor preserves taxonomic diversity by preventing the excessive elimination of long-tail species, ensuring the training set remains representative of the entire ecological community. Simultaneously, the Bottom-Q Rescue maintains environmental diversity by retaining samples that define the boundaries of imaging degradation, such as motion blur or low contrast. By forcing the network to learn from these challenging instances rather than only high-quality data, the strategy acts as an implicit data-level regularizer. This prevents the model from overfitting to high-frequency clear features and significantly enhances its generalisation in real-world degraded scenarios.
2.4. Quality-conditional robust learning
Relying solely on quality cleaning and removal of suspected mislabelled instances can reduce noise proportions and enhance the average quality of training datasets. However, in practical river-lake deployment scenarios, models must continually contend with degraded input issues stemming from factors such as motion blur, occlusion, imaging noise, compression artefacts, and small distant targets. Concurrently, if the cleaned training data becomes excessively biased towards high-quality samples, the model may develop a bias towards easily classified high-quality examples. This leads to insufficient robustness and generalisation capability in low-quality domains. Therefore, this paper leverages Mixup’s regularisation advantages in smoothing decision boundaries and enhancing generalisation. It introduces QCA-Mix, applying Mixup linear combination training to challenging subset samples from the dataset Sfinal. By directing augmentation solely towards selected low-quality challenging subsets, this approach significantly improves the model’s adaptability to real-world degraded scenarios without increasing training costs.
The challenging subset L of the dataset Sfinal is defined as:
Where SfinalBottom denotes the challenging sample set comprising Q% samples with the lowest intra-category quality scores from Sfinal. The standard subset is thus defined as E = Sfinal - L. For a batch B, it is partitioned into the difficult subset BL
Where x denotes the sample, y denotes λ1~Beta(β, β), and β is the Mixup intensity hyperparameter. The loss for the difficult subset is:
Where fθ(·) denotes the classification network, and ℓ(·) represents the cross-entropy loss. When fewer than two challenging samples are present in a batch, it automatically reverts to standard cross-entropy. Standard supervised cross-entropy is employed for regular subsets[38]:
To prevent loss scale shifts caused by fluctuations in the proportion of difficult samples, the final batch loss is weighted and fused based on sample count:
3. RESULTS
To verify the efficacy of the proposed QUC-RL method in addressing image degradation and label noise, we conduct a comprehensive experimental evaluation. The validation process is designed to demonstrate the contribution of individual modules, the robustness of the reconstructed dataset, and the generalisation capability of the framework across different imaging domains. Specifically, we utilise two distinct datasets for our analysis: a private Beijing river-lake bird dataset collected from real-world surveillance and the public CUB-200-2011 dataset for controlled cross-dataset evaluation. The experimental analysis follows a progressive structure, starting from implementation details and metric definitions to in-depth module-level verification and comparative benchmarking against state-of-the-art (SOTA) methods.
3.1. Datasets
The experimental evaluation in this study relies on two datasets: a primary private dataset focused on river-lake avian monitoring in Beijing and the public CUB-200-2011 benchmark used for evaluating cross-dataset generalisation. The primary Beijing river-lake bird dataset originates from Hikvision 4K high-definition network cameras deployed at 15 monitoring stations within Beijing’s key protected aquatic ecosystems. As illustrated in Figure 2, each station is equipped with a professional-grade camera housing and a solar power supply system to ensure stable data acquisition in diverse field conditions. To ensure real-time processing and acquisition efficiency, images captured between May 2022 and December 2023 were first processed via a background subtraction algorithm to filter out redundant static frames. Subsequently, an SSD-based detector[39] was used to localize bird targets and crop individual-bird image patches.
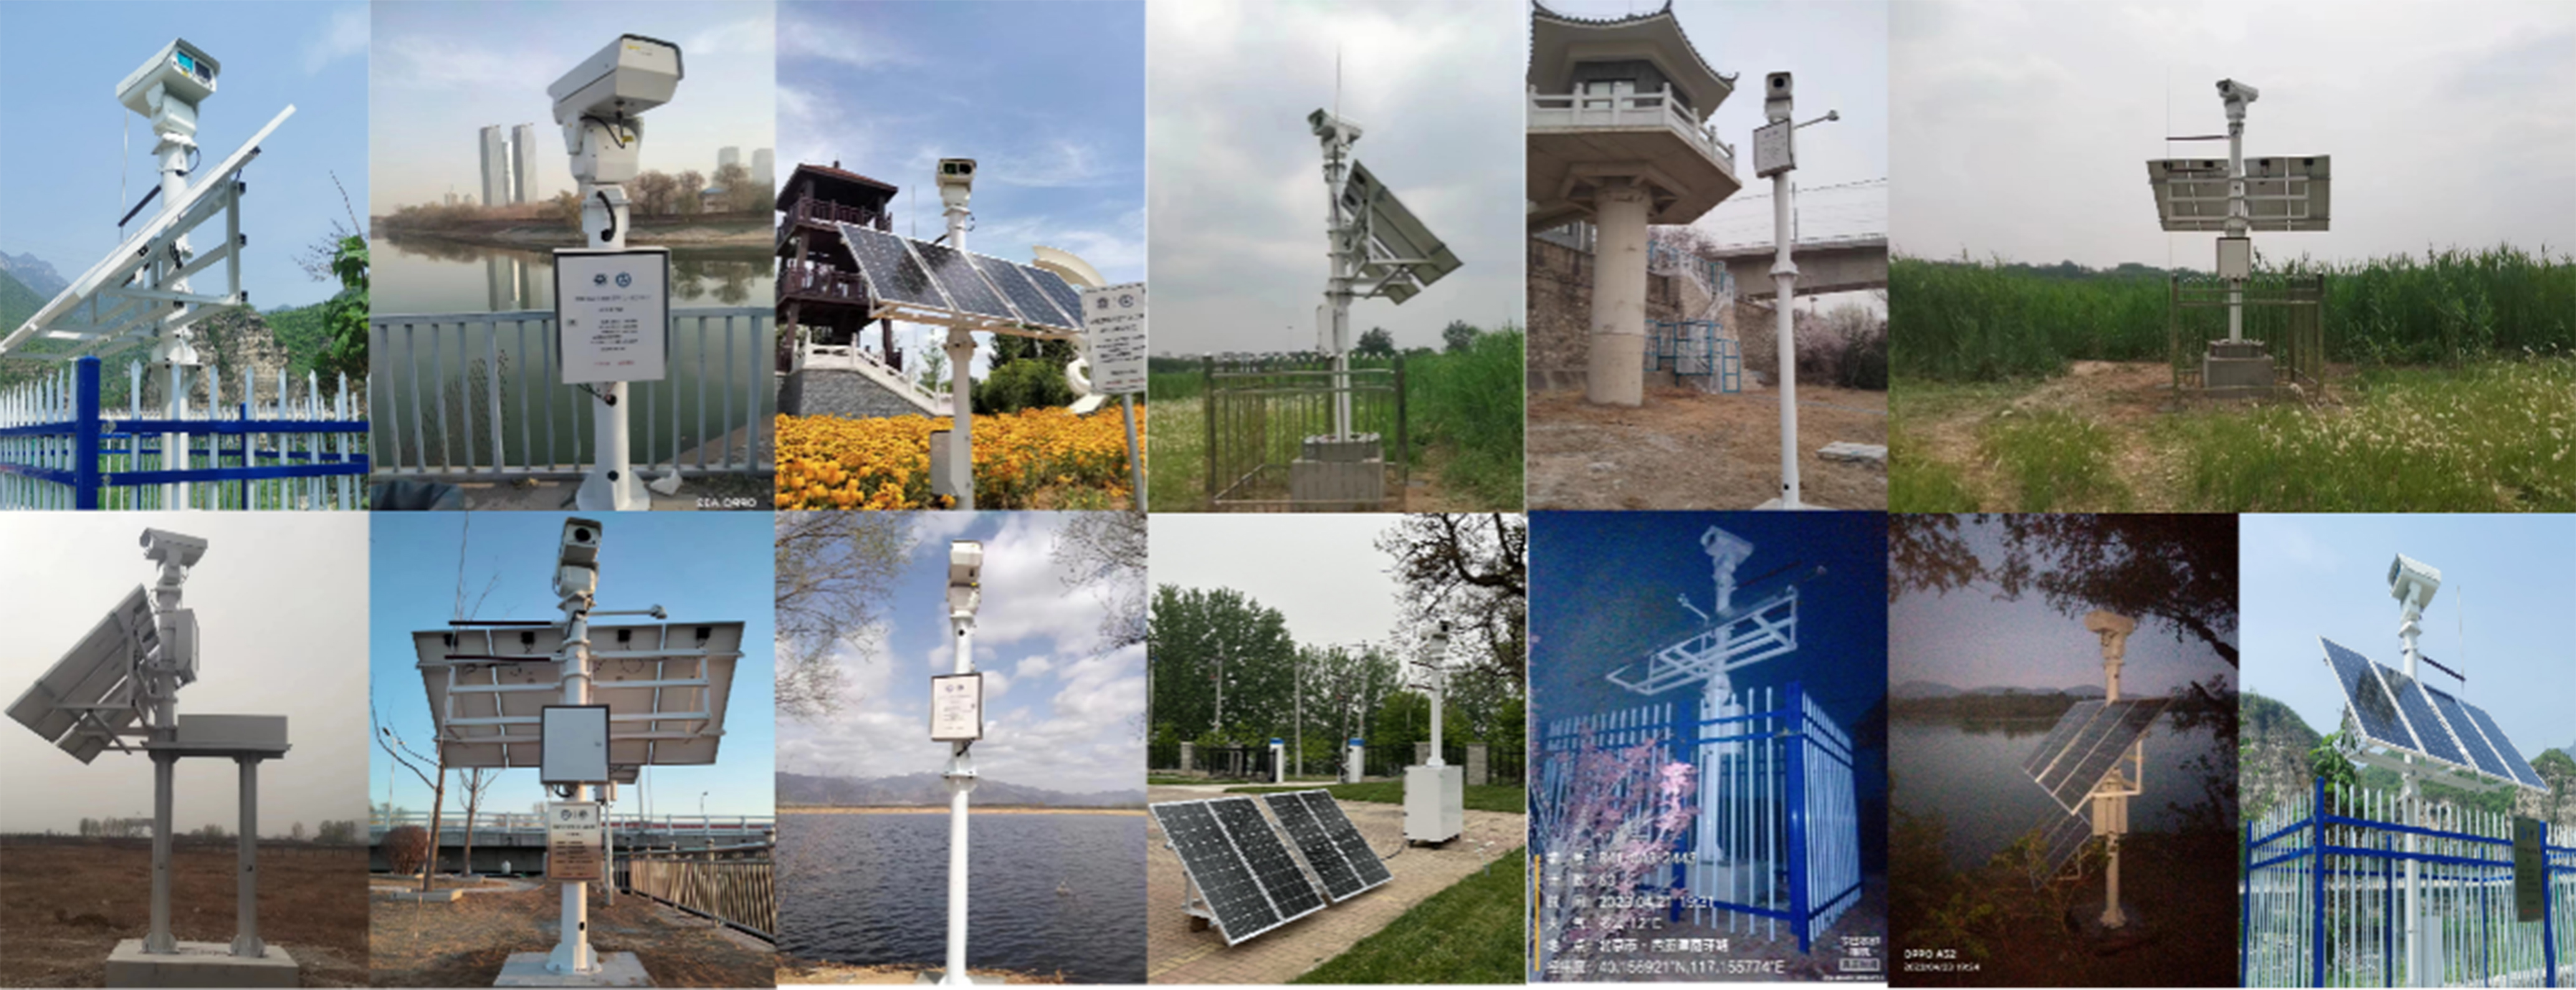
Figure 2. Hardware deployment of the intelligent bird monitoring station under field conditions. Photographs are from the authors’ research project and are reproduced with permission.
The annotation process strictly followed the “A Checklist on the Classification and Distribution of the Birds of China” to ensure taxonomic accuracy. All images were manually labeled using LabelImg software by researchers with ecological backgrounds and subsequently audited by senior experts in the relevant field to rectify any misidentifications. Ambiguous samples, such as those with extreme motion blur or severe occlusion beyond 70%, were systematically excluded to maintain high annotation consistency. The final dataset encompasses 18,272 images across 17 common river-lake bird species, with the specific sample counts summarized in Table 1. To visualize the data characteristics, Figure 3 illustrates the class distribution, revealing the significant long-tail distribution and sample imbalance inherent in real-world ecological monitoring scenarios. Finally, images for each bird species were randomly partitioned into training, validation, and test sets at a ratio of 7:1:2. This partitioning was performed in a stratified manner to ensure that the inherent class distribution is consistently maintained across the training, validation, and test sets. Notably, no explicit oversampling or undersampling was applied during the training phase. Instead, the proposed framework addresses the sample imbalance primarily through the category-preserving design in the data curation stage.
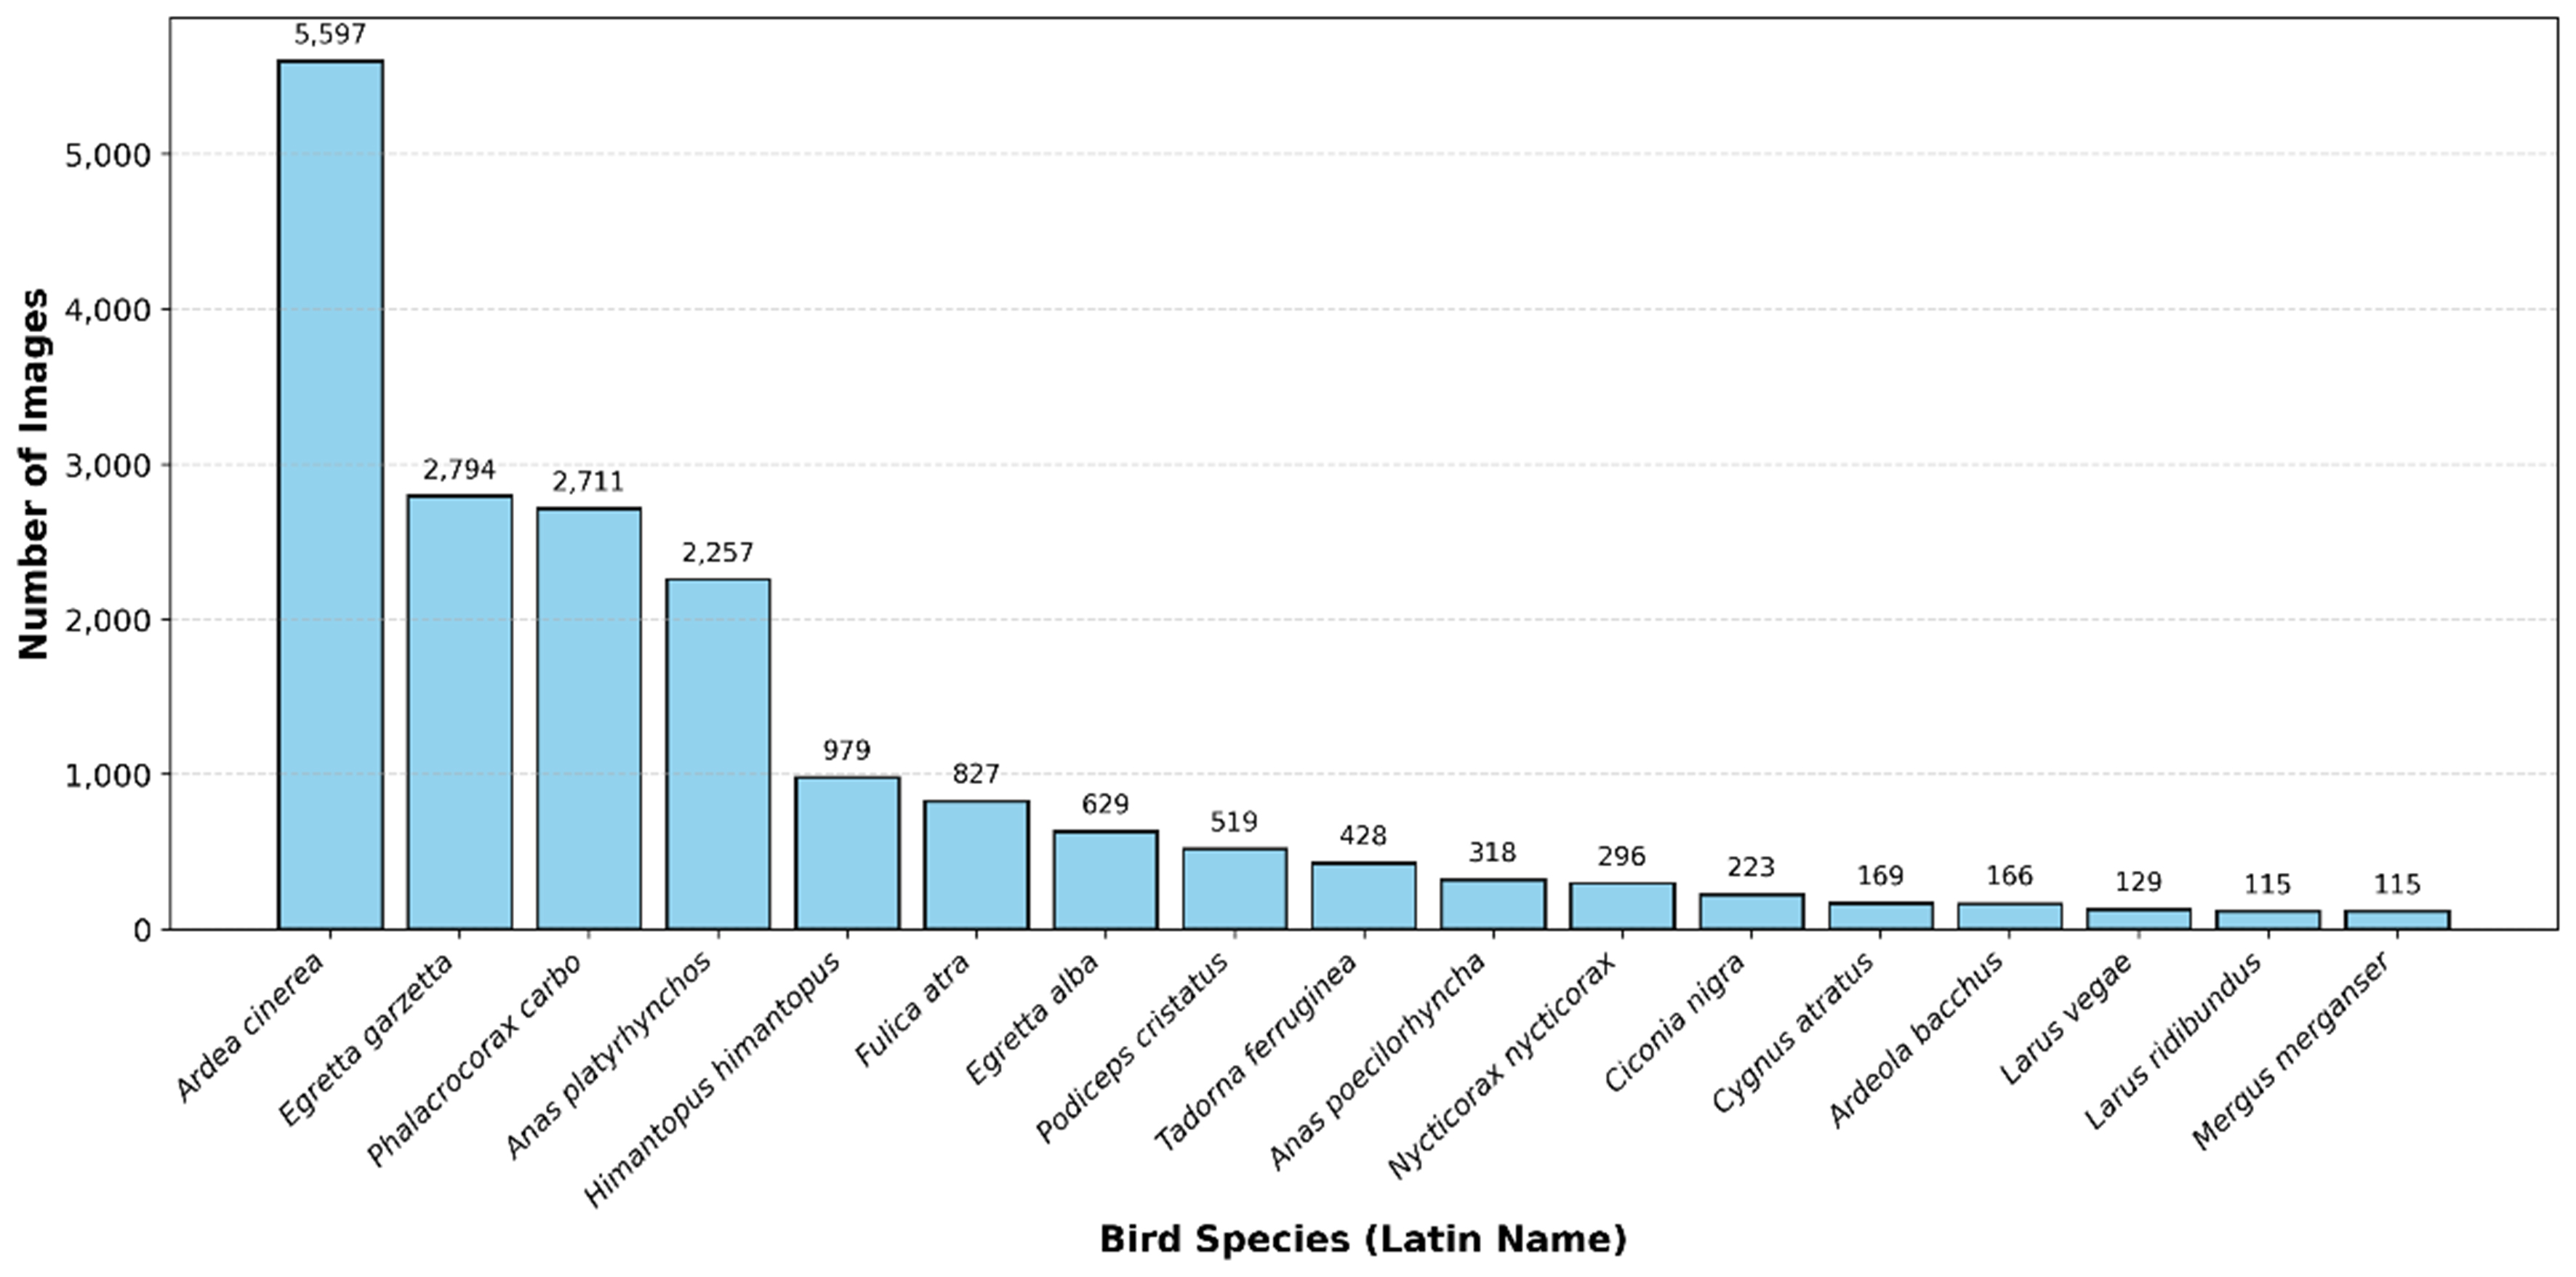
Figure 3. Class distribution of the Beijing River-Lake Bird Dataset.
Number of images of 17 bird species
| Species | Number of images | Species | Number of images |
| Podiceps cristatus | 519 | Anas platyrhynchos | 2,257 |
| Nycticorax nycticorax | 296 | Ardea cinerea | 5,597 |
| Egretta alba | 629 | Larus vegae | 129 |
| Anas poecilorhyncha | 318 | Tadorna ferruginea | 428 |
| Mergus merganser | 115 | Fulica atra | 827 |
| Phalacrocorax carbo | 2,711 | Cygnus atratus | 169 |
| Ardeola bacchus | 166 | Himantopus himantopus | 979 |
| Egretta garzetta | 2,794 | Ciconia nigra | 223 |
| Larus ridibundus | 115 | - | - |
3.2. Implementation details
For reproducibility, the complete hyperparameter configuration of each module is summarised in Table 2. For practical reproducibility, the implementation details are organised stage by stage, and each core module is described in terms of its inputs, outputs, key operations, and default hyperparameter settings.
Hyperparameter settings of QUC-RL
| Component | Hyperparameter | Value |
| Data split | Train/Val/Test | 7:1:2 |
| Stage 1 | Sobel kernel size | ksize = 3 |
| Stage 1 | Gaussian kernel | 5 × 5 |
| Stage 1 | Fusion weights | ω = [0.35, 0.25, 0.25, 0.15] |
| Stage 1 | Quality grade thresholds | topA = 0.80, topB = 0.50 |
| Stage 2 | Input size | 224 × 224 |
| Stage 2 | Batch size | 32 |
| Stage 2 | HOG feature length | 128 |
| Stage 2 | PCA output dimension | 256 |
| Stage 2 | MSCS selection | K-Means |
| Stage 2 | Cluster consistency priors | τmaj = 0.90, τmargin = 0.20 |
| Stage 2 | kNN verification | K = 25, τknn = 0.70 |
| Stage 3 | Hard lower-bound threshold | t min = 0.25 |
| Stage 3 | Threshold scan candidate set | τ∈{0.15, 0.20, 0.25, 0.30, 0.35} |
| Stage 3 | Default threshold used | t* = 0.25 |
| Stage 3 | Category floor | Nfloor = 80 |
| Stage 3 | Bottom-Q rescue | Q% = 20%, K = 20 |
| Stage 4 | Difficulty subset candidates | {Grade(C), Bottom-Q, both, and} |
| Stage 4 | Difficulty proportion | Q% = 10% |
| Stage 4 | Mixup intensity | β = 0.20 |
| Training | Backbone/Optimizer | ResNet50/Adam |
| Training | Initial learning rate | 0.0001 |
| Training | Batch size/Epochs/Patience | 16/20/8 |
In the first stage, the original images I of the training set are taken as input, and the sharpness, contrast, edge strength (ksize = 3), noise (5 × 5 Gaussian residual MAD) are calculated and intra-class Min-Max normalisation is applied. Following the weighting rationale described in Section 2.1, we set the fusion weights to ω = [0.35, 0.25, 0.25, 0.15] for sharpness, contrast, edge strength, and noise, as the default configuration for river–lake monitoring scenarios. These weights provide a reproducible setting and can be recalibrated when transferring across devices or regions.
For evaluation stratification, the default quality-grade cut-offs are set to topA = 0.80 and topB = 0.50.
In the second stage, the image I and stage 1 quality vector q(I) are used as inputs, and ResNet50 semantic features of 2048 dimensions, HOG features and 4-dimensional quality vectors are fused and compressed to 256 dimensions by PCA after Z-score normalisation. Where the input size, batch and hog_size are set to 224, 32 and 128 respectively. the optimal clustering algorithm K-Means is selected using the MSCS module, cluster consistency priors are set as τmaj = 0.90 and τmargin = 0.20, and KNN verification parameters are configured as K = 25 and τknn = 0.70. The output comprises an outlier sample set and a suspected mislabel set Xm.
In the third stage, the base available set Sbase for hard lower bound control of quality scores s is taken as input. Within this stage, s =0.25 is selected as the practical quality threshold from the candidate set τ∈{0.15, 0.20, 0.25, 0.30, 0.35} via threshold scanning. Category floor settings Nfloor = 80, Bottom-Q recovery settings Q% = 20% and K = 20, output the cleaned bird sample set Sfinal.
In the fourth stage, the final training set Sfinal and the difficulty subset L are taken as input. Within this, L selects and from candidate difficulty definitions {Grade(C), Bottom-Q, both, and}, Q% = 10%, and enables QCA-Mix for L. β = 0.20.
To ensure fair comparisons, all comparative experiments employed identical data partitioning and training strategies. The backbone network utilized ResNet50, with Adam serving as the optimiser. The validation set macro-F1 served as the early stopping metric. Input size, initial learning rate, batch size, epochs, and patience were set to 224 × 224 , 0.0001, 16, 20, and 8 respectively.
All experiments were conducted on a workstation equipped with an Intel(R) Xeon(R) Gold 6354 CPU @ 3.00GHz, 1.0 TiB RAM, and an NVIDIA A800 80GB PCIe GPU. The implementation was based on Python 3.11.13, PyTorch 2.5.1, CUDA 12.1, and cuDNN 9.0.1, with OpenCV 4.12.0 and scikit-learn 1.7.2 used for image processing and clustering tasks. For network training, Adam was used as the optimizer with a fixed learning rate of 1× 10⁻⁴ throughout the training process, as no explicit learning rate decay schedule was applied. In the data preprocessing stage, all cropped bird images were resized to 224 × 224 and normalised using the standard ImageNet mean and standard deviation. For the degraded CUB-200-2011 benchmark, the dataset was first split into training, validation, and test subsets, after which the degradation operations were independently applied to each subset to prevent data leakage.
3.3. Evaluation metrics
The MSCS module requires adaptive selection among different clustering algorithms. To evaluate the quality of cluster structures in candidate clustering results, this paper employs three internal metrics: Silhouette, CH, and DB. The number of clusters K is recorded to prevent cluster collapse.
Silhouette: Measures the combined degree of compactness within clusters and separation between clusters. Higher values indicate clearer structure. Let i denote a sample, a(i) be its average distance to in-cluster samples, and b(i) be its average distance to the nearest sample in other clusters. Calculate:
CH: Ratio of inter-cluster variance to intra-cluster variance, favoured when larger. Let k denote the number of clusters, N denote the number of samples, Bk denote the inter-cluster dispersion matrix, and Wk denote the intra-cluster dispersion matrix. Calculate:
DB: The average of the similarity measures between clusters, where lower values are preferable. Let the intra-cluster divergence be si and the distance between cluster centres be d(ci, cj). Calculate:
In the main experiment, the performance of different training set versions was evaluated using a fixed test set. The primary outputs were Top-1 Accuracy (ACC) and Macro-F1, with particular emphasis on the Grade C F1 metric for low-quality domain robustness.
Let the total number of samples in the test set be N, the true labels be yi, and the predicted labels be
For each category c, where C denotes the total number of categories, let TPc, FPc, FNc represent true positives, false positives, and false negatives respectively. Calculate Precision, Recall, F1-score, and Macro-F1:
Deployment-oriented efficiency metrics are additionally reported for practical comparison. Specifically, Params denotes the total number of trainable parameters, GFLOPs measures the computational cost of one forward pass, and FPS denotes the number of test images processed per second under the hardware environment described.
3.4. Experimental results
To validate the efficacy of the QUC-RL algorithm, we conducted multi-level comparative experiments on a fixed test set. To ensure a clear correspondence with the four-module architecture proposed in Section 2, the experimental validation is organized in a progressive manner. The analysis begins with an evaluation of the clustering selection behaviour within the MSCS module, followed by an investigation into the threshold-sensitive reconstruction of the adaptive distribution preservation strategy. Building upon these module-level foundations, we then present a component-wise performance comparison across the progressively constructed variants. Finally, to demonstrate the comprehensive edge of the full framework, we compare QUC-RL against recent SOTA methods and examine its cross-dataset generalisation on the degraded CUB-200-2011 benchmark.
3.4.1. Evaluation of unsupervised clustering selection
The efficacy of unsupervised cleaning is highly dependent on the quality of the cluster structure within the feature space. As shown in Table 3, we present the internal metric evaluations of the MSCS module for three candidate clustering algorithms. This quantitative comparison provides the basis for our algorithm selection.
Unsupervised evaluation of candidate clustering algorithms under MSCS
| Method | Silhouette | CH | DB | Ncluster | Rank decision |
| K-Means | 0.010 | 113.45 | 3.86 | 60 | √ |
| Agglomerative | -0.004 | 100.78 | 4.20 | 60 | × |
| HDBSCAN | 0.222 | 90.87 | 1.55 | 2 | × |
Experimental data indicates that although HDBSCAN appears optimal in terms of Silhouette and DB metrics, the number of clusters it generates Ncluster is merely 2. This demonstrates that the algorithm suffers from severe pattern collapse in the current high-dimensional feature space, rendering it incapable of capturing the fine-grained distribution of 17 bird species. Consequently, it was automatically excluded by the MSCS module under the constraint of minimum cluster count. In contrast, K-Means achieved the highest CH index of 113.45 while maintaining structural integrity (Ncluster = 60), indicating its clusters possess superior inter-class separation and compactness. Consequently, K-Means was ultimately adopted as the foundational architecture for subsequent outlier detection and mislabelling identification.
3.4.2. Threshold sensitivity and data curation
During the adaptive distribution reconstruction phase, the hard lower bound threshold serves as a critical hyperparameter determining both the scale and quality of the foundational usable set. An excessively low threshold introduces extremely low-quality noise that disrupts training, whilst an excessively high threshold unduly favours high-quality, easily obtainable samples whilst excluding challenging samples of high discriminative value, thereby diminishing performance in low-quality domains. This paper conducts a threshold scan for τ∈{0.15, 0.20, 0.25, 0.30, 0.35}. At each threshold, two levels of difficult sample protection are enabled, and the number of samples rescued is recorded for analysis. Table 4 presents the threshold scan results. Figure 4 further illustrates the trade-off among balanced utility, keep ratio, and mean quality.
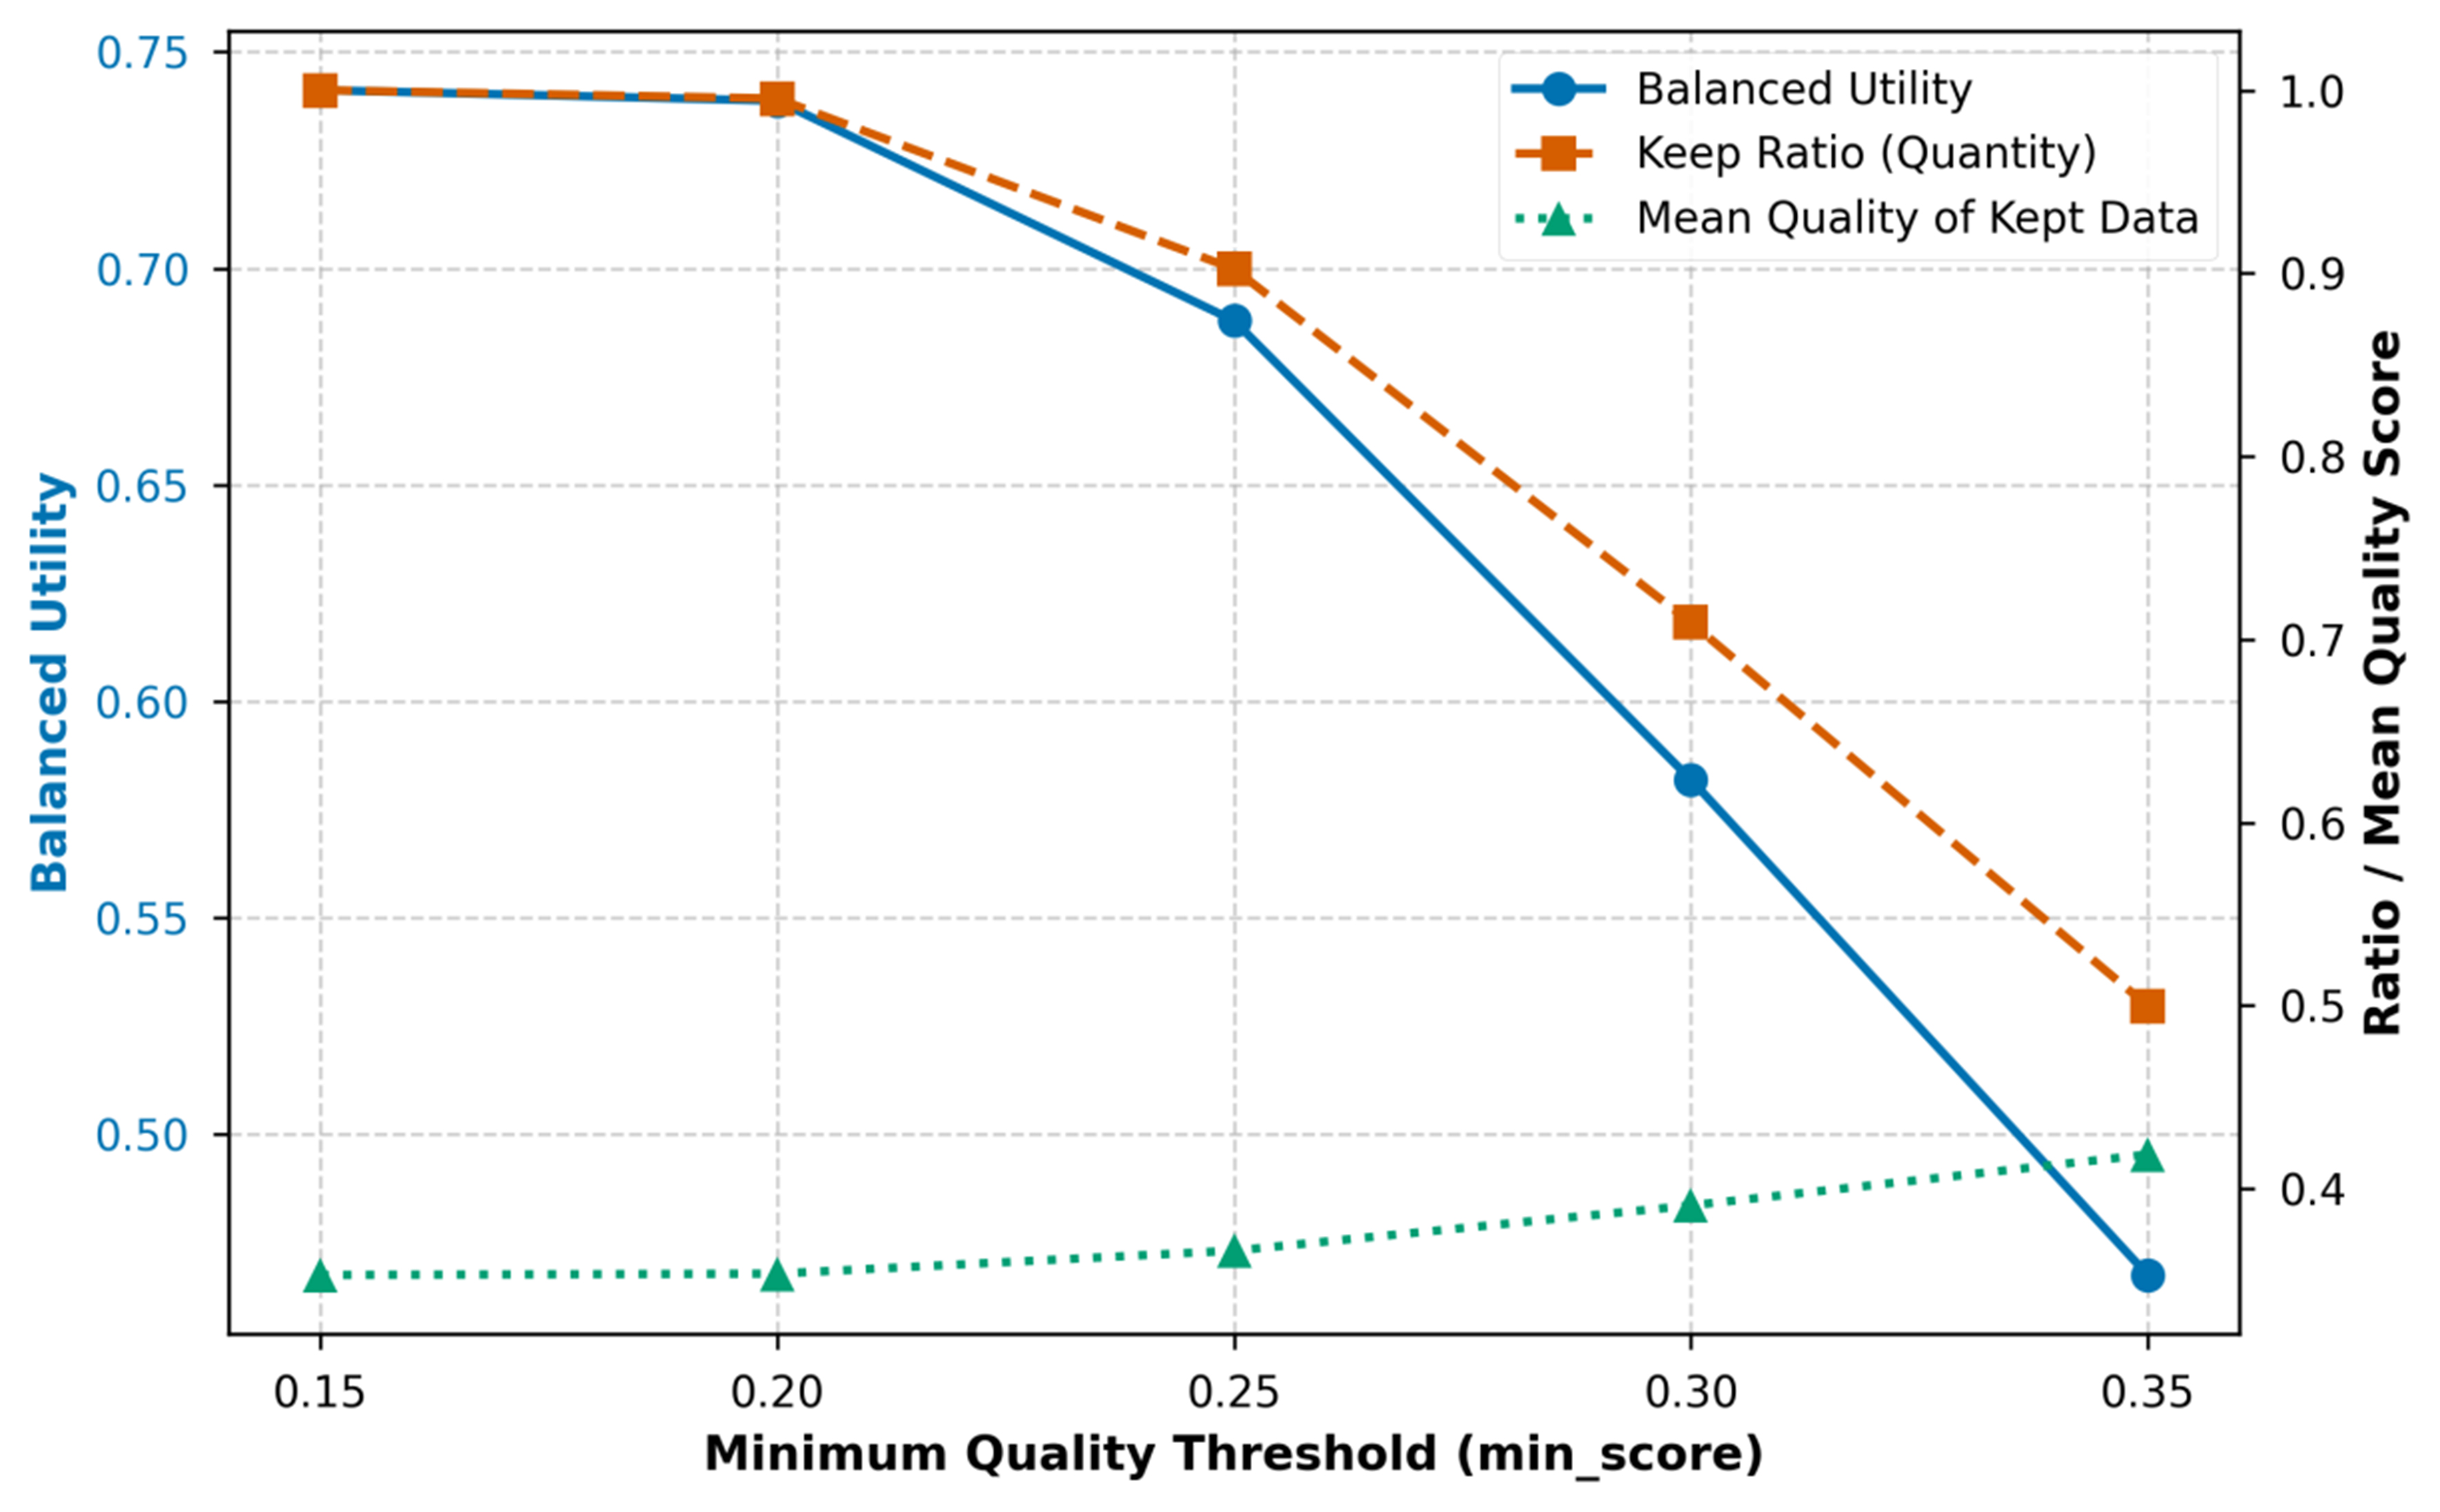
Figure 4. Trade-off curves of balanced utility, keep ratio, and mean quality under different minimum quality thresholds (threshold sweep).
Threshold sweep results: retention, mean quality, and rescue statistics under different minimum quality thresholds
| s | Nkept(s) | r(s) | | U(s) | Rfloor | Rbottom |
| 0.15 | 11758 | 1.000 | 0.353 | 0.741 | 0 | 0 |
| 0.20 | 11704 | 0.995 | 0.354 | 0.739 | 0 | 18 |
| 0.25 | 10610 | 0.902 | 0.366 | 0.688 | 21 | 118 |
| 0.30 | 8339 | 0.709 | 0.391 | 0.582 | 226 | 324 |
| 0.35 | 5878 | 0.500 | 0.419 | 0.467 | 509 | 324 |
Taken together, it is evident that as the threshold increases from 0.15 to 0.35, the keep ratio gradually decreases from 1.000 to 0.500, while the average quality rises from 0.353 to 0.419, exhibiting a typical trade-off trend of quantity decline and quality improvement.
Crucially, this threshold sweep essentially serves as a sensitivity analysis for the most influential hyperparameter in our adaptive distribution preservation strategy, namely the quality threshold s. The comprehensive utility U(s) exhibits a decreasing trend with increasing thresholds, indicating that the impact of s on performance is not monotonic but governed by a delicate balance. When s = 0.15, utility peaks mathematically as almost no samples are deleted; however, the retained set contains substantial severely degraded noise, which weakens the effectiveness of curation and compromises training stability. Conversely, when s is too large, it excludes too many informative hard samples, drastically reducing retention rates and risking distribution collapse. For instance, at the extreme high threshold of s = 0.35, the floor mechanism rescued 509 samples while Bottom-Q rescued 324, indicating excessive intervention was required to compensate for the lost category and hard-sample coverage. Balancing noise removal, distribution preservation, and rescue intensity, this study ultimately selects s = 0.25 as the default threshold for subsequent main experiments, as it provides the best compromise under this trade-off.
The keep ratio is computed as r(s) = Nkept(s)/Nbase(s), where Nkept(s) and Nbase(s) denote the number of retained samples and the baseline available set under threshold s, respectively.
To further validate the impact of cleaning and distribution preservation strategies on data quality structure, Figure 5 compares the quality score distributions of the RAW training set and the Clean-V2 retained subset. In this context, RAW denotes the original uncurated dataset, while Clean-V2 represents the version reconstructed through our proposed quality scoring, unsupervised auditing, and adaptive distribution preservation strategies. As can be seen from Figure 5, the Clean-V2 distribution shifts rightwards towards the high-quality range, with its mean increasing from 0.347 to 0.366, indicating that unsupervised governance effectively removed some low-quality noisy samples. Concurrently, the distribution retains a pronounced low-quality long tail.
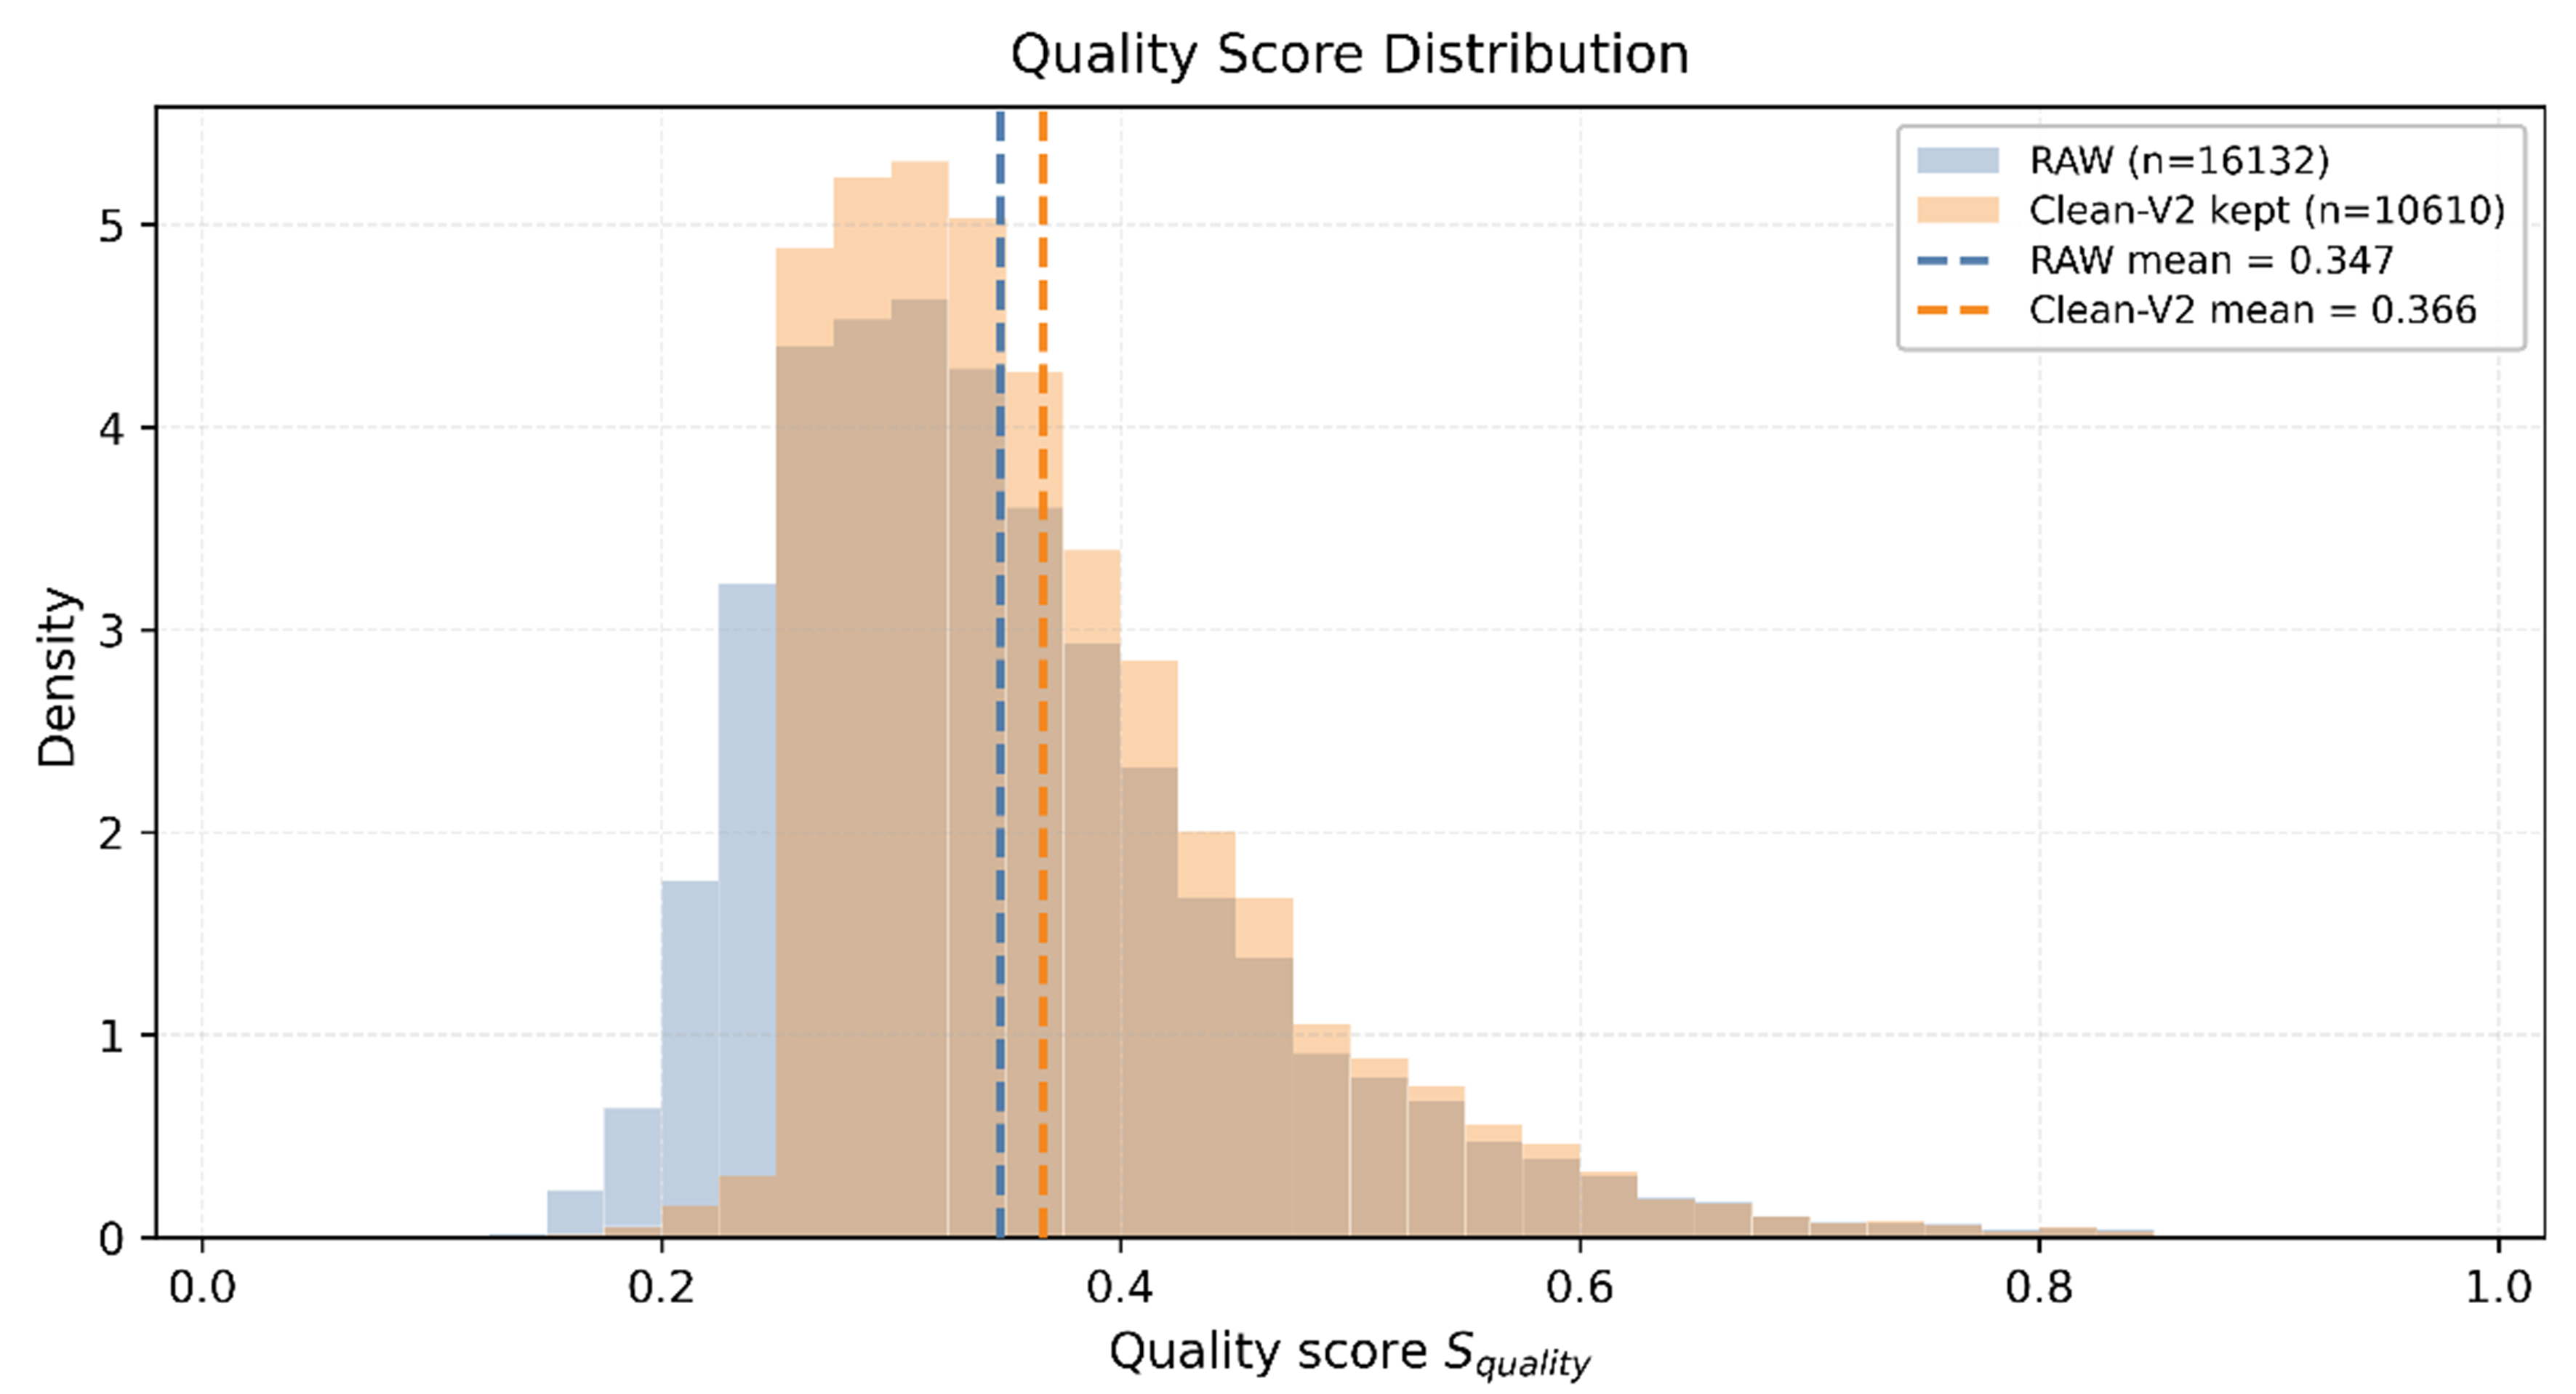
Figure 5. Quality score distribution comparison between RAW and Clean-V2 training sets. Dashed vertical lines indicate the mean quality scores of the two sets. RAW grade ratio: C = 50.0%, B = 30.0%, A = 20.0%.
Moreover, Figure 6 provides representative visual evidence of typical examples and outliers across different quality grades (A/C). Grade A samples typically feature clear textures and complete contours, with prominent subjects and minimal background interference; Grade C samples exhibit degraded characteristics such as severe motion blur, reflections, low contrast, or distant small targets, representing the most challenging low-quality domain inputs in real-world river-lake monitoring. Outlier samples often exhibit anomalous patterns significantly deviating from the category distribution, such as severe occlusion or cropping resulting in subject loss, background dominance, extreme lighting and reflections, or intense noise.
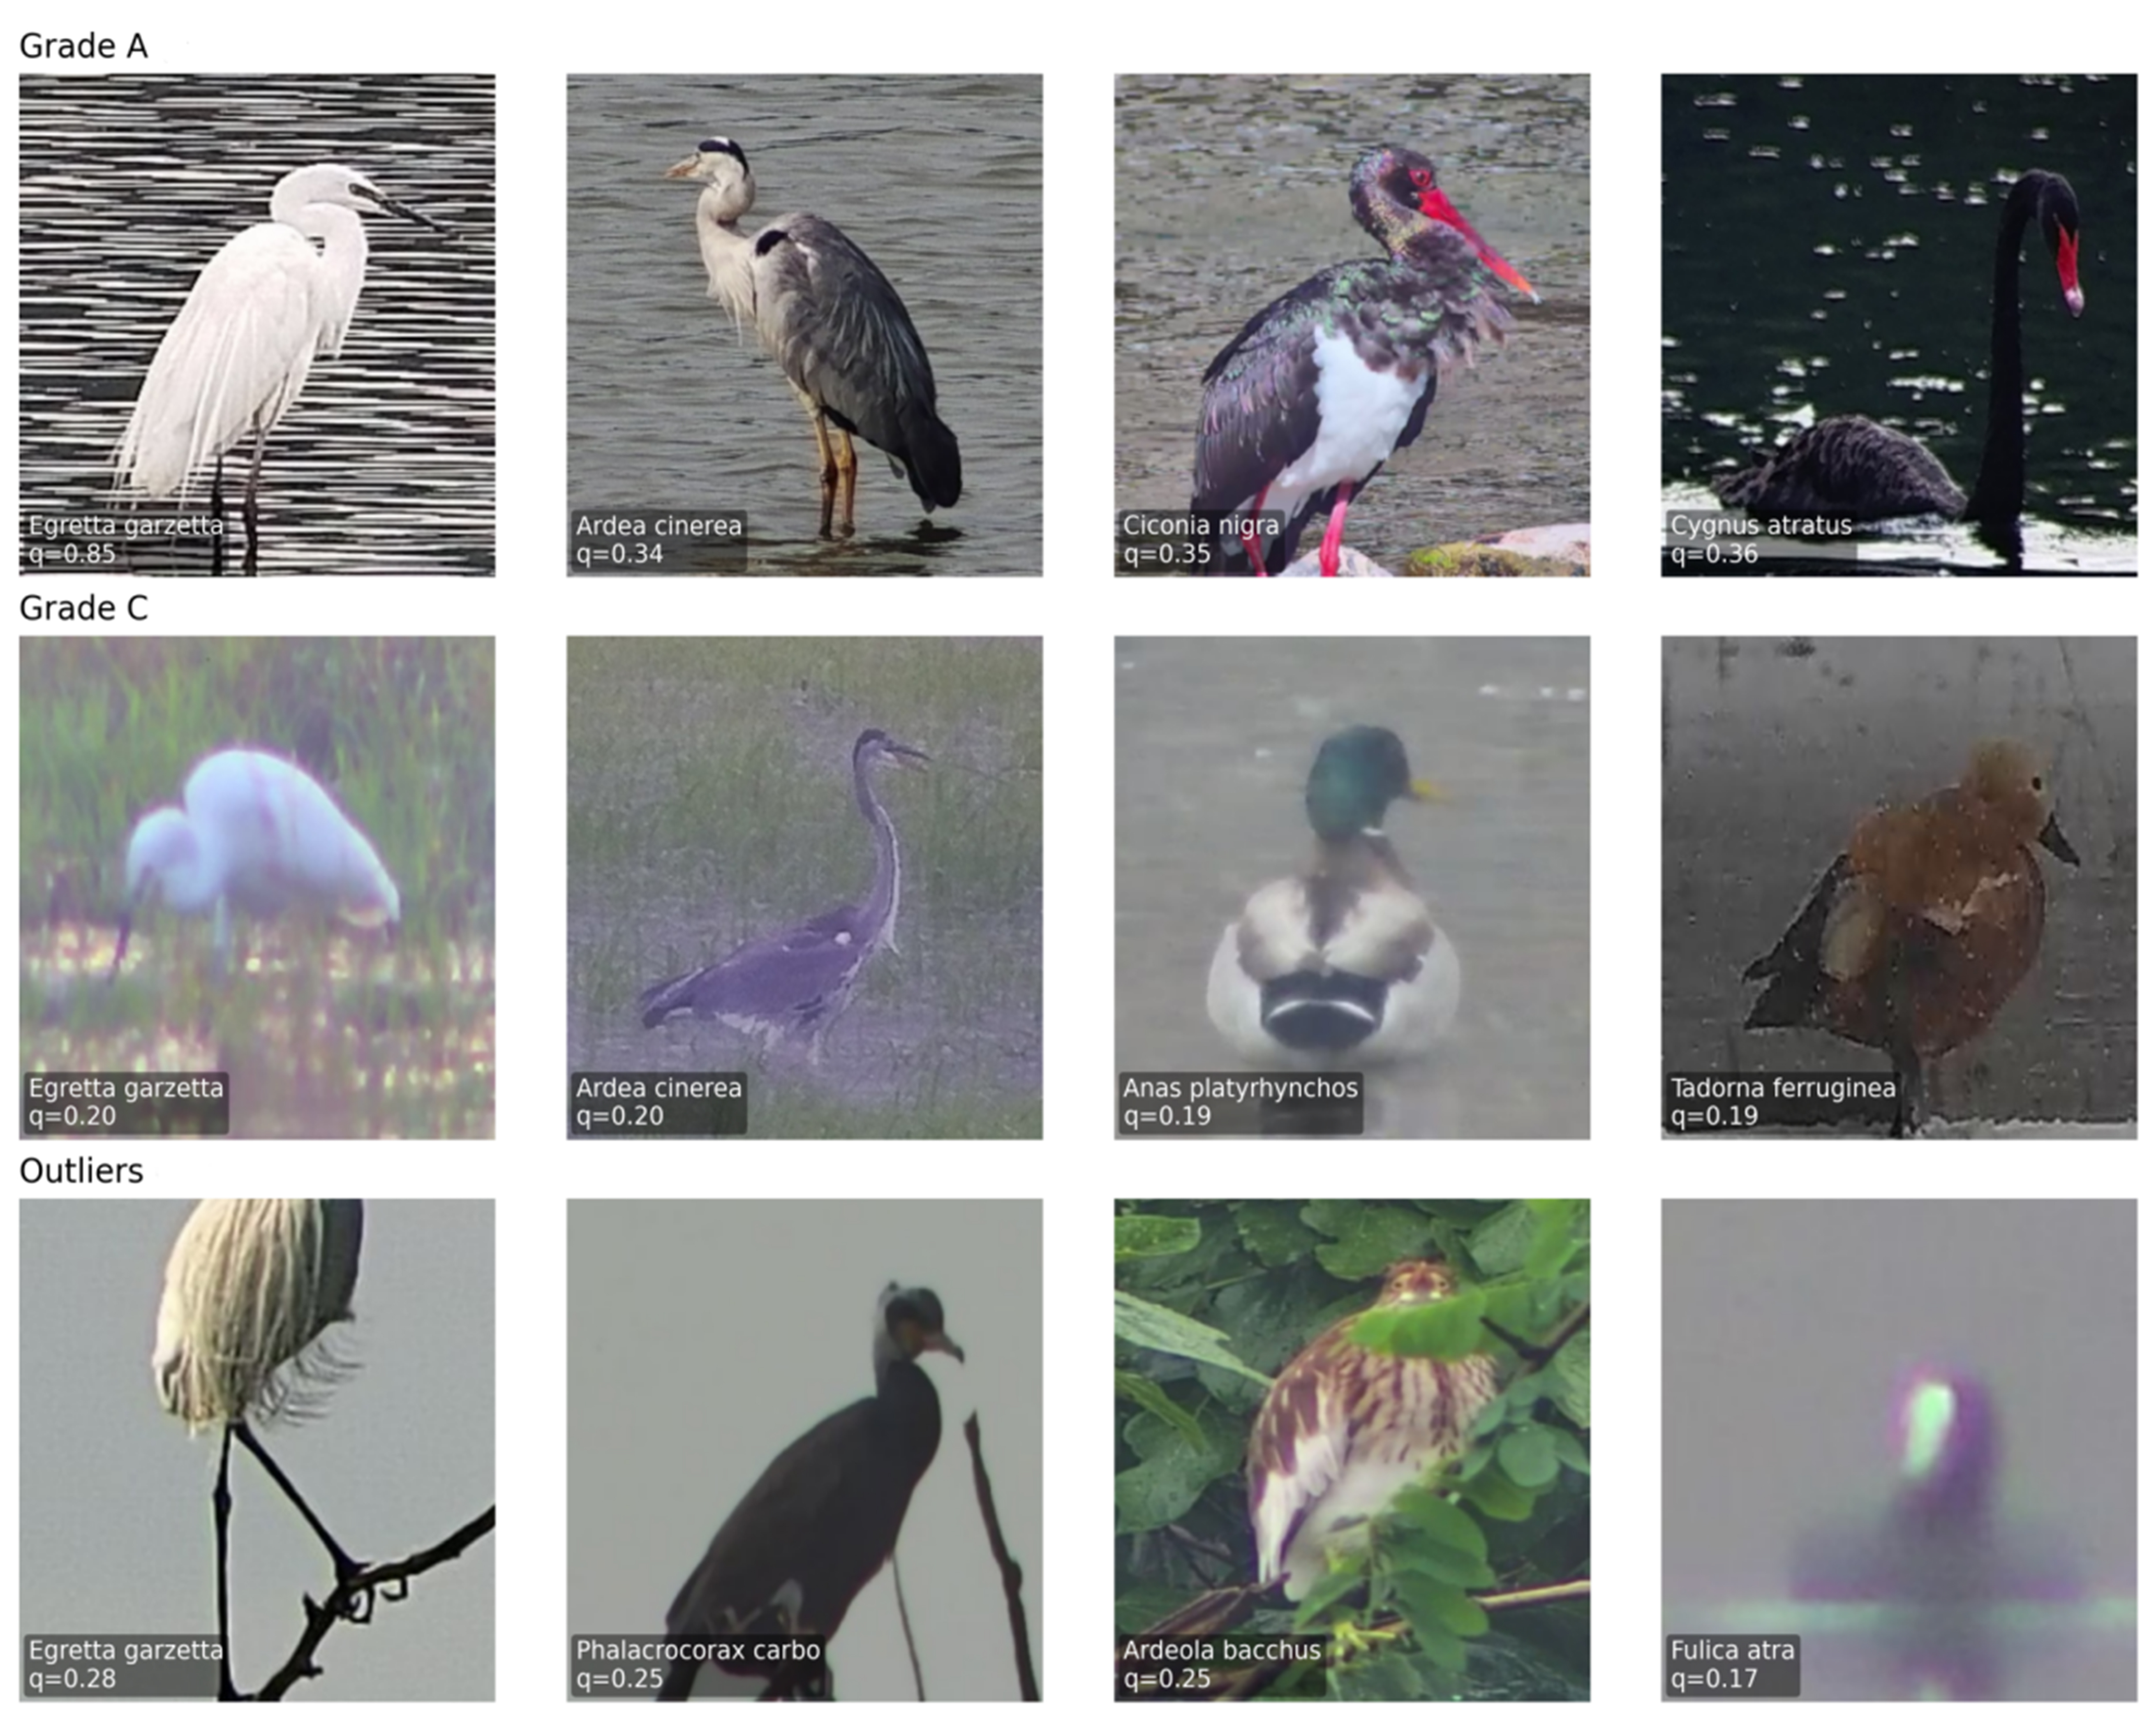
Figure 6. Visualisation of representative samples across quality Grades A/C and outliers. Photographs are from the authors’ research project and are reproduced with permission.
3.4.3. Comparative analysis of model performance
This paper compares six progressively constructed training variants under fixed dataset partitioning and identical ResNet50 backbone to provide a component-wise analysis of the proposed framework. As summarized in Table 5, the variants are defined by their corresponding names and the activation status of four core modules, namely M1 for Quality Scoring, M2 for MSCS Auditing, M3 for Adaptive Distribution Preservation, and M4 for Quality-Conditional Augmentation. Importantly, since all variants are based on the same backbone and implement data-centric curation, they maintain a constant parameter count of 23.543M and a computational load of 4.132 GFLOPs, ensuring that performance gains do not come at the expense of architectural complexity. To objectively evaluate performance under the inherent class imbalance of the bird dataset, Macro-F1 is reported alongside Accuracy as a primary metric throughout the experiments. Unlike Accuracy, which is biased toward majority classes, Macro-F1 treats each species with equal weight regardless of its sample size, providing a more rigorous assessment of the model’s robustness on long-tail categories.
Component ablation study of the proposed QUC-RL framework
| M1 | M2 | M3 | M4 | Train size | FPS (frames/s) | Accuracy (%) | Macro-F1 (%) | Grade C-F1 (%) |
| × | × | × | × | 12789 | 252.913 | 95.705 | 94.184 | 94.566 |
| √ | √ | × | × | 6129 | 251.106 | 94.692 | 91.068 | 88.492 |
| √ | × | √ | √ | 11054 | 252.541 | 96.224 | 95.522 | 95.412 |
| √ | √ | √ | × | 10610 | 251.743 | 96.334 | 94.711 | 94.850 |
| √ | √ | √ | Global* | 10610 | 252.790 | 96.361 | 95.402 | 95.467 |
| √ | √ | √ | √ | 10610 | 249.814 | 96.580 | 95.807 | 96.362 |
Table 5 demonstrates that the baseline RAW model with all modules disabled achieves a Macro-F1 of 94.184% when trained on the original noisy data. Applying the M1 quality scoring and M2 auditing modules while relying on aggressive cleaning without preservation mechanisms corresponds to the Clean-V1 variant. In this setup with M3 disabled, the training scale is heavily reduced to 6,129 samples. This causes Accuracy to drop to 94.692% and Macro-F1 to 91.068%, with the low-quality domain F1 plummeting to 88.492%. This aligns with the analysis in Section 3.4.2, highlighting that overly stringent thresholds cause distribution shifts requiring substantial recovery mechanisms for compensation.
To validate the necessity of the unsupervised auditing module, we introduced a variant that bypasses the MSCS mechanism, denoted as QUC-RL w/o M2. Retaining the original label noise in this variant caused the accuracy to drop from the full framework’s 96.580% to 96.224%, confirming that omitting noise filtering undermines the learning foundation.
In contrast, activating the M3 adaptive distribution preservation module in the Clean-V2 variant maintains data distribution integrity while reducing redundancy. Despite limiting the training scale to 10,610, Clean-V2 restores and elevates Accuracy to 96.334% and Macro-F1 to 94.711%. Grade C F1 reached 94.850%, demonstrating that purifying noise while preserving informative low-quality samples effectively mitigates distribution collapse.
After applying data augmentation, the model’s performance was further enhanced. Implementing global Mixup in the Clean-V2 + Mixup variant elevated the Macro-F1 score to 95.402% and the Grade C F1 score to 95.467%. However, global augmentation treats all samples equally, potentially dispersing limited training capacity. Finally, the proposed QUC-RL activates the M4 targeted quality-conditional augmentation to allocate budgets more efficiently towards challenging domains. Results demonstrate QUC-RL achieves optimal performance, with Accuracy reaching 96.580%, Macro-F1 attaining 95.807%, and the highest F1 of 96.362% achieved on the Grade C subset. This significant gain on the Grade C subset indicates that the M4 quality-conditional augmentation improves low-quality feature learning not merely by generic interpolation, but by concentrating the network’s representational capacity on the most challenging degraded samples. Consequently, the local decision boundaries around blurred, low-contrast, or partially occluded features are significantly smoothed, thereby enhancing feature discriminability specifically within the low-quality domain. Across all variants, the inference speed remains highly efficient at approximately 250 FPS, confirming the practical feasibility of QUC-RL.
The above comparison provides progressive evidence for the cumulative contribution of aggressive cleaning, adaptive distribution-preserving reconstruction, and quality-conditional robust learning. To more directly isolate individual mechanisms, we further added a strict leave-one-component-out ablation for the main curation and robust-learning mechanisms in Table 6.
Strict leave-one-component-out ablation of QUC-RL
| Variant | Train size | Accuracy (%) | Macro-F1 (%) | Grade C-F1 (%) | Macro-F1 drop |
| Full QUC-RL | 9067 | 96.498 | 95.926 | 95.946 | - |
| w/o MSCS auditing | 9551 | 96.088 | 94.425 | 95.188 | -1.501 |
| w/o distribution preservation | 8970 | 96.334 | 94.919 | 95.863 | -1.007 |
| w/o class-floor preservation | 9067 | 96.334 | 94.949 | 95.008 | -0.977 |
| w/o Bottom-Q rescue | 8976 | 95.650 | 94.460 | 95.326 | -1.466 |
| w/o QCA-Mix | 9067 | 95.705 | 94.619 | 95.379 | -1.307 |
Compared with Full QUC-RL, removing each major downstream mechanism led to a decline in Macro-F1 or Grade C-F1. Removing MSCS auditing caused a 1.501 percentage-point drop in Macro-F1, indicating that multi-strategy auditing is important for filtering harmful outliers and suspected mislabelled samples. Removing Bottom-Q rescue reduced Macro-F1 by 1.466 percentage points, confirming that retaining informative low-quality hard samples helps avoid over-cleaning. Removing QCA-Mix decreased Macro-F1 by 1.307 percentage points, showing that targeted augmentation on difficult low-quality samples further improves robustness. Removing class-floor preservation and distribution preservation also reduced Macro-F1, supporting their roles in maintaining category coverage and stable category-level performance during reconstruction.
Since quality scoring provides the basic quality representation used by threshold selection, Bottom-Q rescue, and QCA-Mix, directly removing it while keeping all downstream quality-conditioned modules unchanged would make these modules ill-defined. Therefore, the RAW/no-quality-guided curation baseline was retained as a boundary-case reference for the absence of quality-guided data curation, while the strict leave-one-component-out ablation focused on downstream mechanisms that can be independently removed.
3.4.4. Additional hyperparameter sensitivity analysis
Following the threshold analysis in Section 3.4.2, additional sensitivity experiments were conducted for Bottom-Q rescue and QCA-Mix intensity, which directly control difficult-sample retention and quality-conditional augmentation. The quality fusion weights and clustering settings were predefined according to the QUC-RL design: the four quality descriptors provide complementary degradation cues, and MSCS selects the clustering structure using internal validity indices.
Table 7 shows that Bottom-Q rescue has a non-monotonic effect. bottomq10_k20 obtains the highest Accuracy (96.717%) and Macro-F1 (95.357%), whereas bottomq30_k20 achieves the highest Grade C-F1 (95.780%). This indicates that preserving more low-quality candidates can benefit difficult-grade recognition, but excessive rescue may reduce overall class-balanced performance by reintroducing ambiguous samples.
Sensitivity analysis of Bottom-Q rescue settings
| Setting | Train size | Accuracy (%) | Macro-F1 (%) | Grade C-F1 (%) |
| bottomq10_k10 | 9067 | 95.732 | 94.491 | 94.849 |
| bottomq10_k20 | 9141 | 96.717 | 95.357 | 95.353 |
| bottomq10_k30 | 9195 | 96.471 | 94.461 | 95.361 |
| bottomq20_k20 | 9067 | 96.170 | 94.362 | 94.036 |
| bottomq30_k20 | 9003 | 95.978 | 94.442 | 95.780 |
As shown in Table 8, mild-to-moderate QCA-Mix is most effective. The setting Alpha = 0.08 and Prob. = 0.3 achieves the best Macro-F1 (95.926%) and Grade C-F1 (95.946%), while stronger mixing with Alpha = 0.20 reduces both metrics. This suggests that excessive interpolation may weaken fine-grained bird cues, whereas moderate QCA-Mix improves robustness without obscuring discriminative visual details.
Sensitivity analysis of QCA-Mix intensity
| Alpha | Prob. | Accuracy (%) | Macro-F1 (%) | Grade C-F1 (%) |
| 0.04 | 0.3 | 95.787 | 94.827 | 94.922 |
| 0.04 | 0.5 | 96.498 | 95.102 | 95.811 |
| 0.08 | 0.3 | 96.498 | 95.926 | 95.946 |
| 0.08 | 0.5 | 96.115 | 95.126 | 95.238 |
| 0.12 | 0.3 | 96.443 | 95.801 | 95.812 |
| 0.12 | 0.5 | 96.580 | 94.846 | 95.490 |
| 0.20 | 0.3 | 95.212 | 93.716 | 93.630 |
| 0.20 | 0.5 | 96.279 | 94.853 | 94.484 |
Overall, these results indicate that QUC-RL benefits from balanced difficult-sample preservation and moderate quality-conditional augmentation, rather than from an arbitrary single hyperparameter setting.
3.4.5. Comparison with SOTA methods
To further evaluate QUC-RL, we compared it with representative methods, including the recent MobileNetV4 architecture[40], ResNet50+GCE, a representative robust-loss baseline evaluated in recent noisy-label learning research[41], and the recent ConvNeXt-V2 architecture[42]. All methods were evaluated under comparable settings. This comparison aims to verify whether the performance gain of QUC-RL comes merely from standard model components or from the proposed quality-driven data curation and robust learning framework.
As shown in Table 9, QUC-RL achieves the best Macro-F1 and Grade C-F1 among all compared methods, while maintaining competitive inference efficiency. Specifically, QUC-RL maintains a highly efficient real-time inference speed of approximately 250 FPS with a parameter count of 23.543M, indicating its potential suitability for deployment on resource-constrained edge devices in similar river-lake monitoring scenarios. These results confirm that the proposed framework significantly enhances recognition robustness against severe environmental degradations without introducing additional computational overhead during the online inference stage. These findings indicate that simply adopting a stronger backbone or a noise-robust loss is insufficient for severely degraded river-lake bird images. The advantage of QUC-RL lies in integrating quality-aware sample evaluation, unsupervised curation, distribution-preserving reconstruction, and difficulty-oriented augmentation into a unified framework.
Comparison of accuracy and efficiency with SOTA methods
3.4.6. Cross-dataset generalisation on degraded CUB-200-2011
To provide preliminary external evidence beyond the private Beijing river-lake bird dataset, a controlled degradation benchmark was constructed on the CUB-200-2011 dataset. This experiment was designed to examine whether the quality-driven curation strategy remains effective under externally generated low-quality conditions. Degradation operations were applied independently to each split. Specifically, three degradation types were considered: Gaussian blur with kernel size k∈{3, 5, 7}, additive Gaussian noise with zero mean and noise standard deviation σ uniformly sampled from [10, 30] on the 8-bit pixel scale, and JPEG compression artifacts generated by re-encoding with quality factor q randomly sampled from [15, 60]. Each degradation was independently applied with probability 0.5, resulting in diverse single-corruption and mixed-corruption cases. This setting was used to simulate realistic low-quality acquisition conditions for cross-dataset evaluation.
All method-specific hyperparameters were estimated using only the training split, without accessing the held-out test data. In addition, the degraded CUB-200-2011 test set was not assigned explicit quality-grade labels. Therefore, the cross-dataset evaluation in this subsection focuses on the overall Accuracy and Macro-F1 metrics, rather than quality-subset performance.
As shown in Table 10, the proposed QUC-RL retained 93.853% of the training images (7,375 out of 7,858), while improving Accuracy from 76.870% to 77.557% and Macro-F1 from 76.659% to 77.439% compared with the RAW baseline trained on all available data. Although the improvement is modest, QUC-RL achieved better Accuracy and Macro-F1 with fewer training samples on the external degraded benchmark. This suggests that the quality-driven curation strategy can still provide a positive effect beyond the private river-lake dataset under controlled degraded-image conditions.
Cross-dataset generalisation results on degraded CUB-200-2011
| Method | Keep ratio | Accuracy (%) | Macro-F1 (%) |
| Baseline | 100.000% (7,858) | 76.870 | 76.659 |
| QUC-RL | 93.853% (7,375) | 77.557 | 77.439 |
These findings provided additional cross-dataset evidence that the effectiveness of QUC-RL is not restricted to the private river-lake bird dataset. More importantly, they supported the view that, in low-quality image recognition tasks, carefully designed quality-driven curation may be more beneficial than naively retaining all available training data. At the same time, this experiment should be interpreted as controlled transfer evidence rather than proof of broad deployment generalisation. Future work should include cross-camera, cross-location, and cross-season evaluations in real river-lake or wetland monitoring networks to more rigorously assess deployment robustness. Collectively, these analyses establish a progressive validation chain that extends from module-level mechanism verification through to framework-level performance evaluation and cross-dataset generalisation, thereby demonstrating the systemic coherence of the proposed QUC-RL framework.
4. DISCUSSION
The QUC-RL data governance and robust learning algorithm proposed in this study for river and wetland monitoring scenarios addresses the real-world challenges of quality long-tail degradation and label noise. It provides a feasible solution encompassing unsupervised auditing, distribution-preserving reconstruction, and quality-conditional augmentation. Experiments demonstrate that while strong cleaning (Clean-V1) significantly reduces training scale, it causes a marked decline in low-quality domain performance (Grade C F1 drops from 94.566% to 88.492%), reflecting training distribution collapse towards easy samples. This collapse is primarily driven by the unintentional removal of challenging but correctly labelled instances during the cleaning process. When these informative low-quality samples are lost, the network fails to establish robust decision boundaries across the full spectrum of image degradations, leading to a distribution shift where the model overfits to high-quality data. QUC-RL addresses this by utilizing the Category Floor and Bottom-Q mechanisms to ensure that the training set retains its environmental diversity. By preserving these boundary-defining samples, the framework maintains the integrity of the feature space and helps the model maintain stronger robustness under adverse monitoring conditions. In contrast, our proposed hard-sample preservation strategy (Clean-V2) preserves the low-quality tail while improving the overall quality distribution. By further concentrating augmentation budgets on the most critical areas through difficulty-subset-oriented Mixup, it achieves optimal performance across both the overall and low-quality domains (Accuracy = 96.580%, Macro-F1 = 95.807%, Grade C F1 = 96.362%).
Beyond the private Beijing river-lake bird dataset, the proposed framework was further evaluated on degraded CUB-200-2011. The cross-dataset results show that Clean-V2 (QUC-RL) improved both Accuracy and Macro-F1 while retaining only 93.853% of the training samples, providing preliminary evidence that the quality-driven curation strategy can be beneficial beyond the private dataset under controlled degraded-image conditions. More importantly, the result that a curated subset outperformed the RAW baseline trained on all available data further supports our central claim that preserving informative hard samples while removing harmful corrupted instances is more beneficial than naively retaining all training data. Nevertheless, this controlled benchmark should be regarded as supportive transfer evidence rather than a claim of universal applicability. Broader validation on additional public datasets and heterogeneous low-quality imaging scenarios remains an important direction for future work.
From the perspective of practical ecological monitoring, the significance of the QUC-RL framework lies in its ability to reconcile robust recognition with field deployability. In real-world river-lake scenarios, monitoring stations often operate under significant hardware and power constraints, which necessitates a highly efficient processing pipeline for continuous video streams. Our framework addresses these engineering challenges by strictly decoupling the computational load. By confining the intensive data curation and training processes to the offline server-side environment, the model deployed on edge devices remains a lightweight standard backbone. This architectural choice ensures real-time performance, achieving an inference speed of approximately 250 FPS. Ultimately, this allows for reliable and timely bird identification even under severe environmental degradations such as motion blur and reflections, providing a robust technical foundation for long-term avian conservation efforts without demanding excessive edge computing resources.
Nevertheless, this study still has several limitations that warrant further investigation. First, the specific quality metrics and threshold settings may require recalibration when the camera hardware, acquisition distance, or illumination conditions change across different monitoring regions. In particular, the current study has not yet conducted a full cross-camera, cross-location, or cross-season deployment evaluation. Therefore, the reported external validation should be regarded as preliminary evidence, and future work will collect heterogeneous monitoring data across devices, sites, and seasons to further verify the robustness of QUC-RL. A targeted solution to address this issue is to introduce unsupervised domain adaptation, enabling the quality scoring thresholds to adjust robustly under novel deployment conditions. Second, the precision of clustering-based unsupervised auditing is inherently bound by the discriminative capability of the representation space. Since the current validation relies primarily on a standard backbone, future work should explore self-supervised pretraining or domain-adaptive embedding optimisation to construct a more stable representation space for outlier detection. Third, the present framework operates solely on static images, leaving the temporal continuity of monitoring videos unexploited. Incorporating temporal consistency modeling across multiple frames offers a promising direction to further enhance the identification of low-quality samples and improve cross-scenario robustness. Furthermore, the potential of image restoration techniques to actively enhance the quality of degraded samples remains a valuable direction to be explored. Finally, integrating a human-in-the-loop active learning strategy may provide a targeted solution to minimize the manual review cost of high-risk samples during practical engineering deployment.
5. CONCLUSIONS
This study developed QUC-RL, a quality-driven data curation and robust learning framework for low-quality bird images acquired in river-lake monitoring scenarios. By integrating quality-aware scoring, label-aware unsupervised auditing, distribution-preserving reconstruction, and quality-conditional augmentation, QUC-RL removes harmful noise while retaining informative difficult samples. Experiments on the Beijing river-lake bird dataset showed that the full QUC-RL framework achieved an Accuracy of 96.580%, a Macro-F1 of 95.807%, and a Grade C F1 of 96.362%, demonstrating improved robustness on low-quality bird images without increasing online inference complexity. The controlled degraded CUB-200-2011 experiment further provided supplementary transfer evidence, showing that quality-driven curation can remain beneficial beyond the private dataset under controlled degradation conditions. Overall, this study indicates that data-centric quality governance is an effective strategy for robust bird recognition in complex ecological monitoring scenarios. Future work will focus on cross-camera, cross-location, and cross-season validation, as well as adaptive quality modelling for heterogeneous monitoring environments.
DECLARATIONS
Acknowledgments
The functional elements used in Graphic Abstract and Figure 1 were created using resources from iconfont (https://iconfont.cn) for academic illustration purposes. The photographs in Figures 1, 2, 6 and Graphic Abstract were obtained from the authors’ research project and are reproduced here with permission.
Authors’ contributions
Conceptualization, writing-review and editing, funding acquisition: Zhao, Z.
Conceptualization, methodology, data curation, formal analysis, writing - original draft: Duan, X.
Conceptualization, methodology, writing - review and editing: Zhou, Y.
Formal analysis, visualization: Zhao, S.
Data curation, formal analysis: Sun, Y.
Availability of data and materials
The proprietary Beijing river-lake bird datasets used during the current study originate from a long-term river-lake bird monitoring project and are not publicly available due to institutional data management policy restrictions. However, these datasets can be requested from the corresponding author upon reasonable request and subject to permission from the data owner.
AI and AI-assisted tools statement
During the preparation of this manuscript, ChatGPT (OpenAI, GPT-5, released 2025-08-07) was used solely for language editing. The tool did not influence the study design, data collection, analysis, interpretation, or the scientific content of the work. All authors take full responsibility for the accuracy, integrity, and final content of the manuscript.
Financial support and sponsorship
This work was supported by the Beijing Nova Program (20240484720), the Project of Cultivation for Young Top-Notch Talents of Beijing Municipal Institutions (BPHR202203043).
Conflicts of interest
All authors declared that there are no conflicts of interest.
Ethical approval and consent to participate
Not applicable.
Consent for publication
Not applicable.
Copyright
© The Author(s) 2026.
REFERENCES
1. Prychepa, M.; Kovalenko, Y. Waterfowl as indicators of the state of wetland ecosystems. In Innovation in Science: Global Trends and Regional Aspect, Proceedings of the Conference, Riga, Latvia, March 12-13, 2021; Baltija Publishing: Riga, 2021; pp. 9-12.
2. Peng, J.; Wang, D.; Liao, X.; et al. Wild animal survey using UAS imagery and deep learning: modified Faster R-CNN for kiang detection in Tibetan Plateau. ISPRS. J. Photogramm. Remote. Sens. 2020, 169, 364-76.
3. Chen, X.; Pu, H.; He, Y.; et al. An efficient method for monitoring birds based on object detection and multi-object tracking networks. Animals 2023, 13, 1713.
4. Zhang, Z.; Zhang, L.; Lu, B.; et al. Temporal insights into ecological community: advancing waterbird monitoring with dome camera and deep learning. J. Environ. Manage. 2025, 387, 125769.
5. Wu, E.; Wang, H.; Lu, H.; et al. Unlocking the potential of deep learning for migratory waterbirds monitoring using surveillance video. Remote. Sens. 2022, 14, 514.
6. Chalmers, C.; Fergus, P.; Wich, S.; et al. Removing human bottlenecks in bird classification using camera trap images and deep learning. Remote. Sens. 2023, 15, 2638.
7. Mulero-Pérez, D.; Rodriguez-Juan, J.; Ramirez-Gordillo, T.; et al. A federated learning architecture for bird species classification in wetlands. J. Sens. Actuator. Netw. 2025, 14, 71.
8. Oba, Y.; Doi, H. Accelerating ecosystem monitoring through computer vision with deep metric learning. Ecol. Complex. 2025, 62, 101124.
9. Wah, C.; Branson, S.; Welinder, P.; Perona, P.; Belongie, S. The Caltech-UCSD Birds-200-2011 Dataset. 2011. https://authors.library.caltech.edu/records/cvm3y-5hh21. (accessed 2026-06-24).
10. Ma, J.; Guo, J.; Zheng, X.; Fang, C. An improved bird detection method using surveillance videos from Poyang Lake based on YOLOv8. Animals 2024, 14, 3353.
11. Fang, S.; Shen, Y.; Zou, H.; Yin, Y.; Jin, W.; Zhou, H. Birds-YOLO: a bird detection model for Dongting Lake based on modified YOLOv11. Biology 2025, 14, 1515.
12. Huang, Q.; Zhang, C.; Hu, C.; Xie, J.; Wang, Y.; Zhang, J. Waterbird image recognition using lightweight deep learning in wetland environment. Avian. Res. 2025, 16, 100306.
13. He, J.; Chen, J.; Liu, S.; et al. TransFG: a transformer architecture for fine-grained recognition. AAAI 2022, 36, 852-60.
14. Du, R.; Chang, D.; Bhunia, A. K.; et al. Fine-grained visual classification via progressive multi-granularity training of jigsaw patches. arXiv 2020, arXiv:2003.03836. Available online: https://doi.org/10.48550/arXiv.2003.03836. (accessed 2026-06-24).
15. Xie, S.; Xie, J.; Liu, Y.; et al. Step-by-step to success: multi-stage learning driven robust audiovisual fusion network for fine-grained bird species classification. Avian. Res. 2025, 16, 100280.
16. Zha, D.; Bhat, Z. P.; Lai, K. H.; et al. Data-centric artificial intelligence: a survey. arXiv 2023, arXiv:2303.10158. Available online: https://doi.org/10.48550/arXiv.2303.10158. (accessed 2026-06-24).
17. Song, H.; Kim, M.; Park, D.; Shin, Y.; Lee, J. G. Learning from noisy labels with deep neural networks: a survey. IEEE. Trans. Neural. Netw. Learn. Syst. 2023, 34, 8135-53.
18. Northcutt, C.; Jiang, L.; Chuang, I. Confident learning: estimating uncertainty in dataset labels. JAIR 2021, 70, 1373-411.
19. Feuer, B.; Xu, J.; Cohen, N.; et al. SELECT: a large-scale benchmark of data curation strategies for image classification. arXiv 2024, arXiv:2410.05057. Available online: https://doi.org/10.48550/arXiv.2410.05057. (accessed 2026-06-24).
20. Drenkow, N.; Unberath, M. A causal framework for aligning image quality metrics and deep neural network robustness. npj. Artif. Intell. 2025, 1, 24.
21. Liu, Y.; Zhang, H.; Che, X.; Zhang, W.; Lu, G. Deep learning based fine‐grained image classification: recent advances, applications and future outlook. IET. Image. Process. 2025, 19, e70243.
22. Zhang, L.; Zhou, Y.; Gao, F.; et al. Q-Norm: robust representation learning via quality-adaptive normalization. In 2025 IEEE/CVF International Conference on Computer Vision (ICCV), Honolulu, USA, October 19-23, 2025; IEEE: 2025; pp. 13901-11.
23. Jiang, K.; Jiang, J.; Liu, X.; Yao, H.; Lin, C. W. PH-Mamba: enhancing Mamba with position encoding and harmonized attention for image deraining and beyond. IEEE. Trans. Image. Process. 2026, 35, 1727-39.
24. Xiao, Y.; Yuan, Q.; Jiang, K.; Chen, Y.; Wang, S.; Lin, C. W. Multi-axis feature diversity enhancement for remote sensing video super-resolution. IEEE. Trans. Image. Process. 2025, 34, 1766-78.
25. Jiang, K.; Wang, Z.; Yi, P.; et al. Rain-free and residue hand-in-hand: a progressive coupled network for real-time image deraining. IEEE. Trans. Image. Process. 2021, 30, 7404-18.
26. Müller, S. G.; Hutter, F. TrivialAugment: tuning-free yet state-of-the-art data augmentation. arXiv 2021, arXiv:2103.10158. Available online: https://doi.org/10.48550/arXiv.2103.10158. (accessed 2026-06-24).
27. Wang, P.; Zhao, Z.; Wen, H.; et al. LLM-AutoDA: large language model-driven automatic data augmentation for long-tailed problems. In Advances in Neural Information Processing Systems 37 (NeurIPS 2024), Vancouver, Canada, Dec 10-15, 2024; Curran Associates, Inc.: 2024; pp. 115783-814.
28. Pearson, K. LIII. On lines and planes of closest fit to systems of points in space. Lond. Edinb. Dublin. Philos. Mag. J. Sci. 1901, 2, 559-72.
29. Pech-Pacheco, J. L.; Cristobal, G.; Chamorro-Martinez, J.; Fernandez-Valdivia, J. Diatom autofocusing in brightfield microscopy: a comparative study. In Proceedings of the 15th International Conference on Pattern Recognition, Barcelona, Spain, September 3-7, 2000; IEEE: 2000; pp. 3318-21.
30. Moulden, B.; Kingdom, F.; Gatley, L. F. The standard deviation of luminance as a metric for contrast in random-dot images. Perception 1990, 19, 79-101.
31. Duda, R.; Hart, P. Pattern classification and scene analysis. Wiley: 1973. https://books.google.com/books?id=POMGRAAACAAJ&source=gbs_ViewAPI. (accessed 2026-06-24).
32. Hampel, F. R. The influence curve and its role in robust estimation. J. Am. Stat. Assoc. 1974, 69, 383-93.
33. Bao, Y.; Kang, G.; Yang, L.; Duan, X.; Zhao, B.; Zhang, B. Normalizing batch normalization for long-tailed recognition. arXiv 2025, arXiv:2501.03122. Available online: https://doi.org/10.48550/arXiv.2501.03122. (accessed 2026-06-24).
34. Mcinnes, L.; Healy, J.; Astels, S. hdbscan: hierarchical density based clustering. J. Open. Source. Softw. 2017, 2, 205.
35. Gagolewski, M.; Bartoszuk, M.; Cena, A. Are cluster validity measures (in) valid? Inform. Sci. 2021, 581, 620-36.
37. Zhang, H.; Cisse, M.; Dauphin, Y. N.; Lopez-Paz, D. mixup: beyond empirical risk minimization. arXiv 2017, arXiv:1710.09412. Available online: https://doi.org/10.48550/arXiv.1710.09412. (accessed 2026-06-24).
38. Murphy, K. P. Probabilistic machine learning: an introduction. MIT Press: 2022. https://probml.github.io/pml-book/book1.html. (accessed 2026-06-24).
39. Liu, W.; Anguelov, D.; Erhan, D.; et al. SSD: single shot MultiBox detector. In: Leibe B, Matas J, Sebe N, Welling M, editors. Computer Vision - ECCV 2016. Cham: Springer International Publishing; 2016. pp. 21-37.
40. Qin, D.; Leichner, C.; Delakis, M.; et al. MobileNetV4: universal models for the mobile ecosystem. In: Leonardis A, Ricci E, Roth S, Russakovsky O, Sattler T, Varol G, editors. Computer Vision - ECCV 2024. Cham: Springer Nature Switzerland; 2025. pp. 78-96.
41. Wang, J.; Liu, X.; Zhou, X.; et al. Joint asymmetric loss for learning with noisy labels. In Proceedings of the IEEE/CVF International Conference on Computer Vision, Honolulu, USA, October 19-23, 2025; pp. 1947-56.
Cite This Article
How to Cite
Download Citation
Export Citation File:
Type of Import
Tips on Downloading Citation
Citation Manager File Format
Type of Import
Direct Import: When the Direct Import option is selected (the default state), a dialogue box will give you the option to Save or Open the downloaded citation data. Choosing Open will either launch your citation manager or give you a choice of applications with which to use the metadata. The Save option saves the file locally for later use.
Indirect Import: When the Indirect Import option is selected, the metadata is displayed and may be copied and pasted as needed.
About This Article
Copyright

Data & Comments
Data
0


Comments
Comments must be written in English. Spam, offensive content, impersonation, and private information will not be permitted. If any comment is reported and identified as inappropriate content by OAE staff, the comment will be removed without notice. If you have any queries or need any help, please contact us at support@oaepublish.com.