


fig3
From: A responder-informed gut microbial consortium enhances anti-PD-1 efficacy in a mouse cancer model
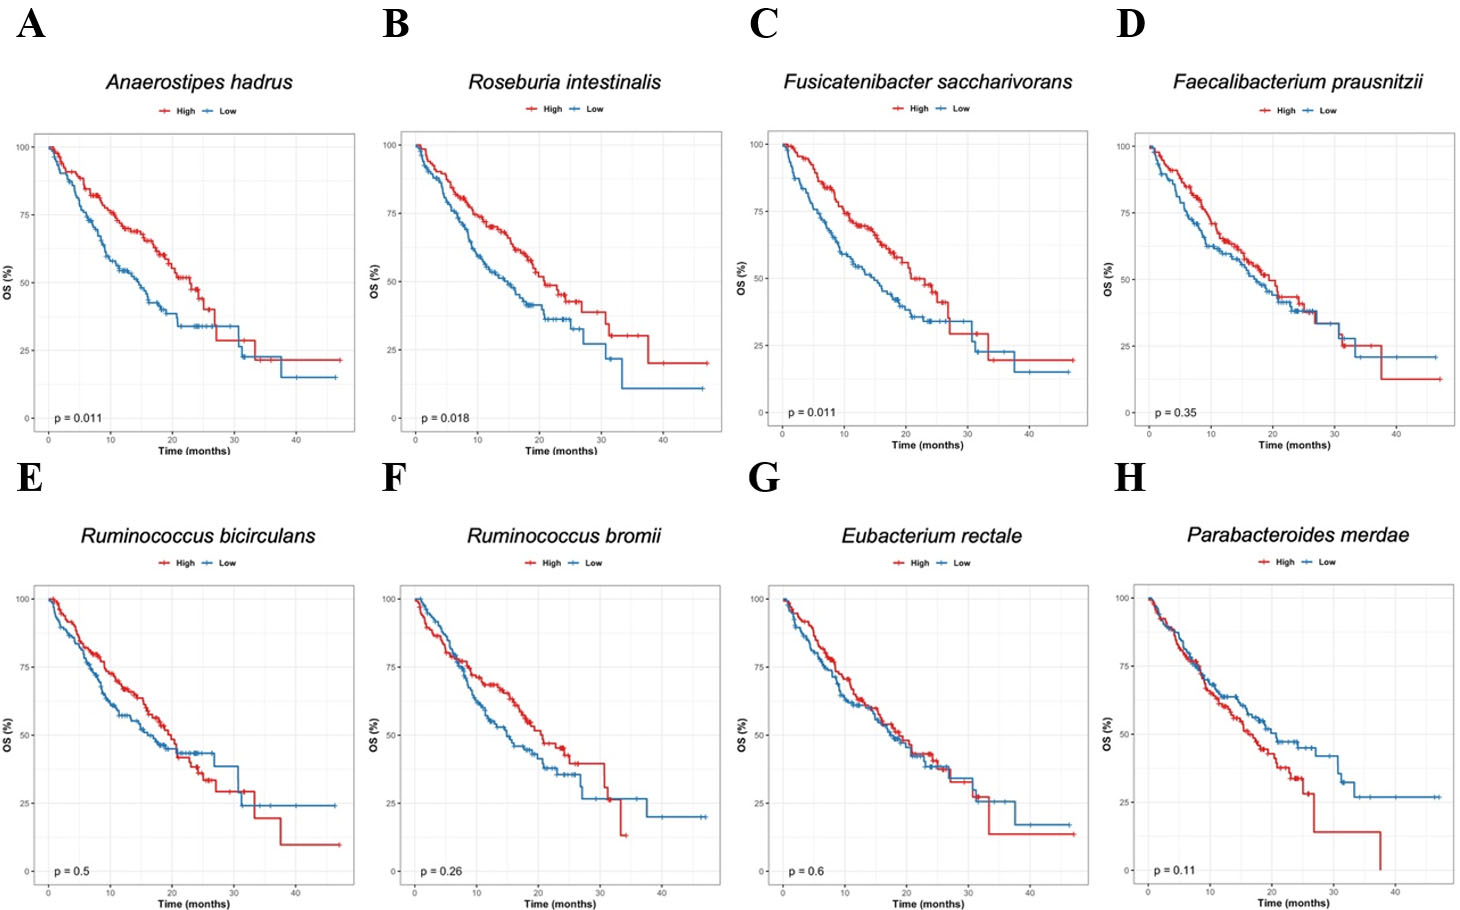
Figure 3. Association between responder-enriched species and overall survival. Kaplan-Meier OS curves for patients stratified by baseline relative abundance of responder-enriched candidate species. For each species, patients were divided into high- and low-abundance groups using the median baseline relative abundance as the cutoff, and OS was compared using the log-rank test. (A) Anaerostipes hadrus; (B) Roseburia intestinalis; (C) Fusicatenibacter saccharivorans; (D) Faecalibacterium prausnitzii; (E) Ruminococcus bicirculans; (F) Ruminococcus bromii; (G) Eubacterium rectale; (H) Parabacteroides merdae. P-values from log-rank tests are indicated in each panel. OS: Overall survival.


