

fig5
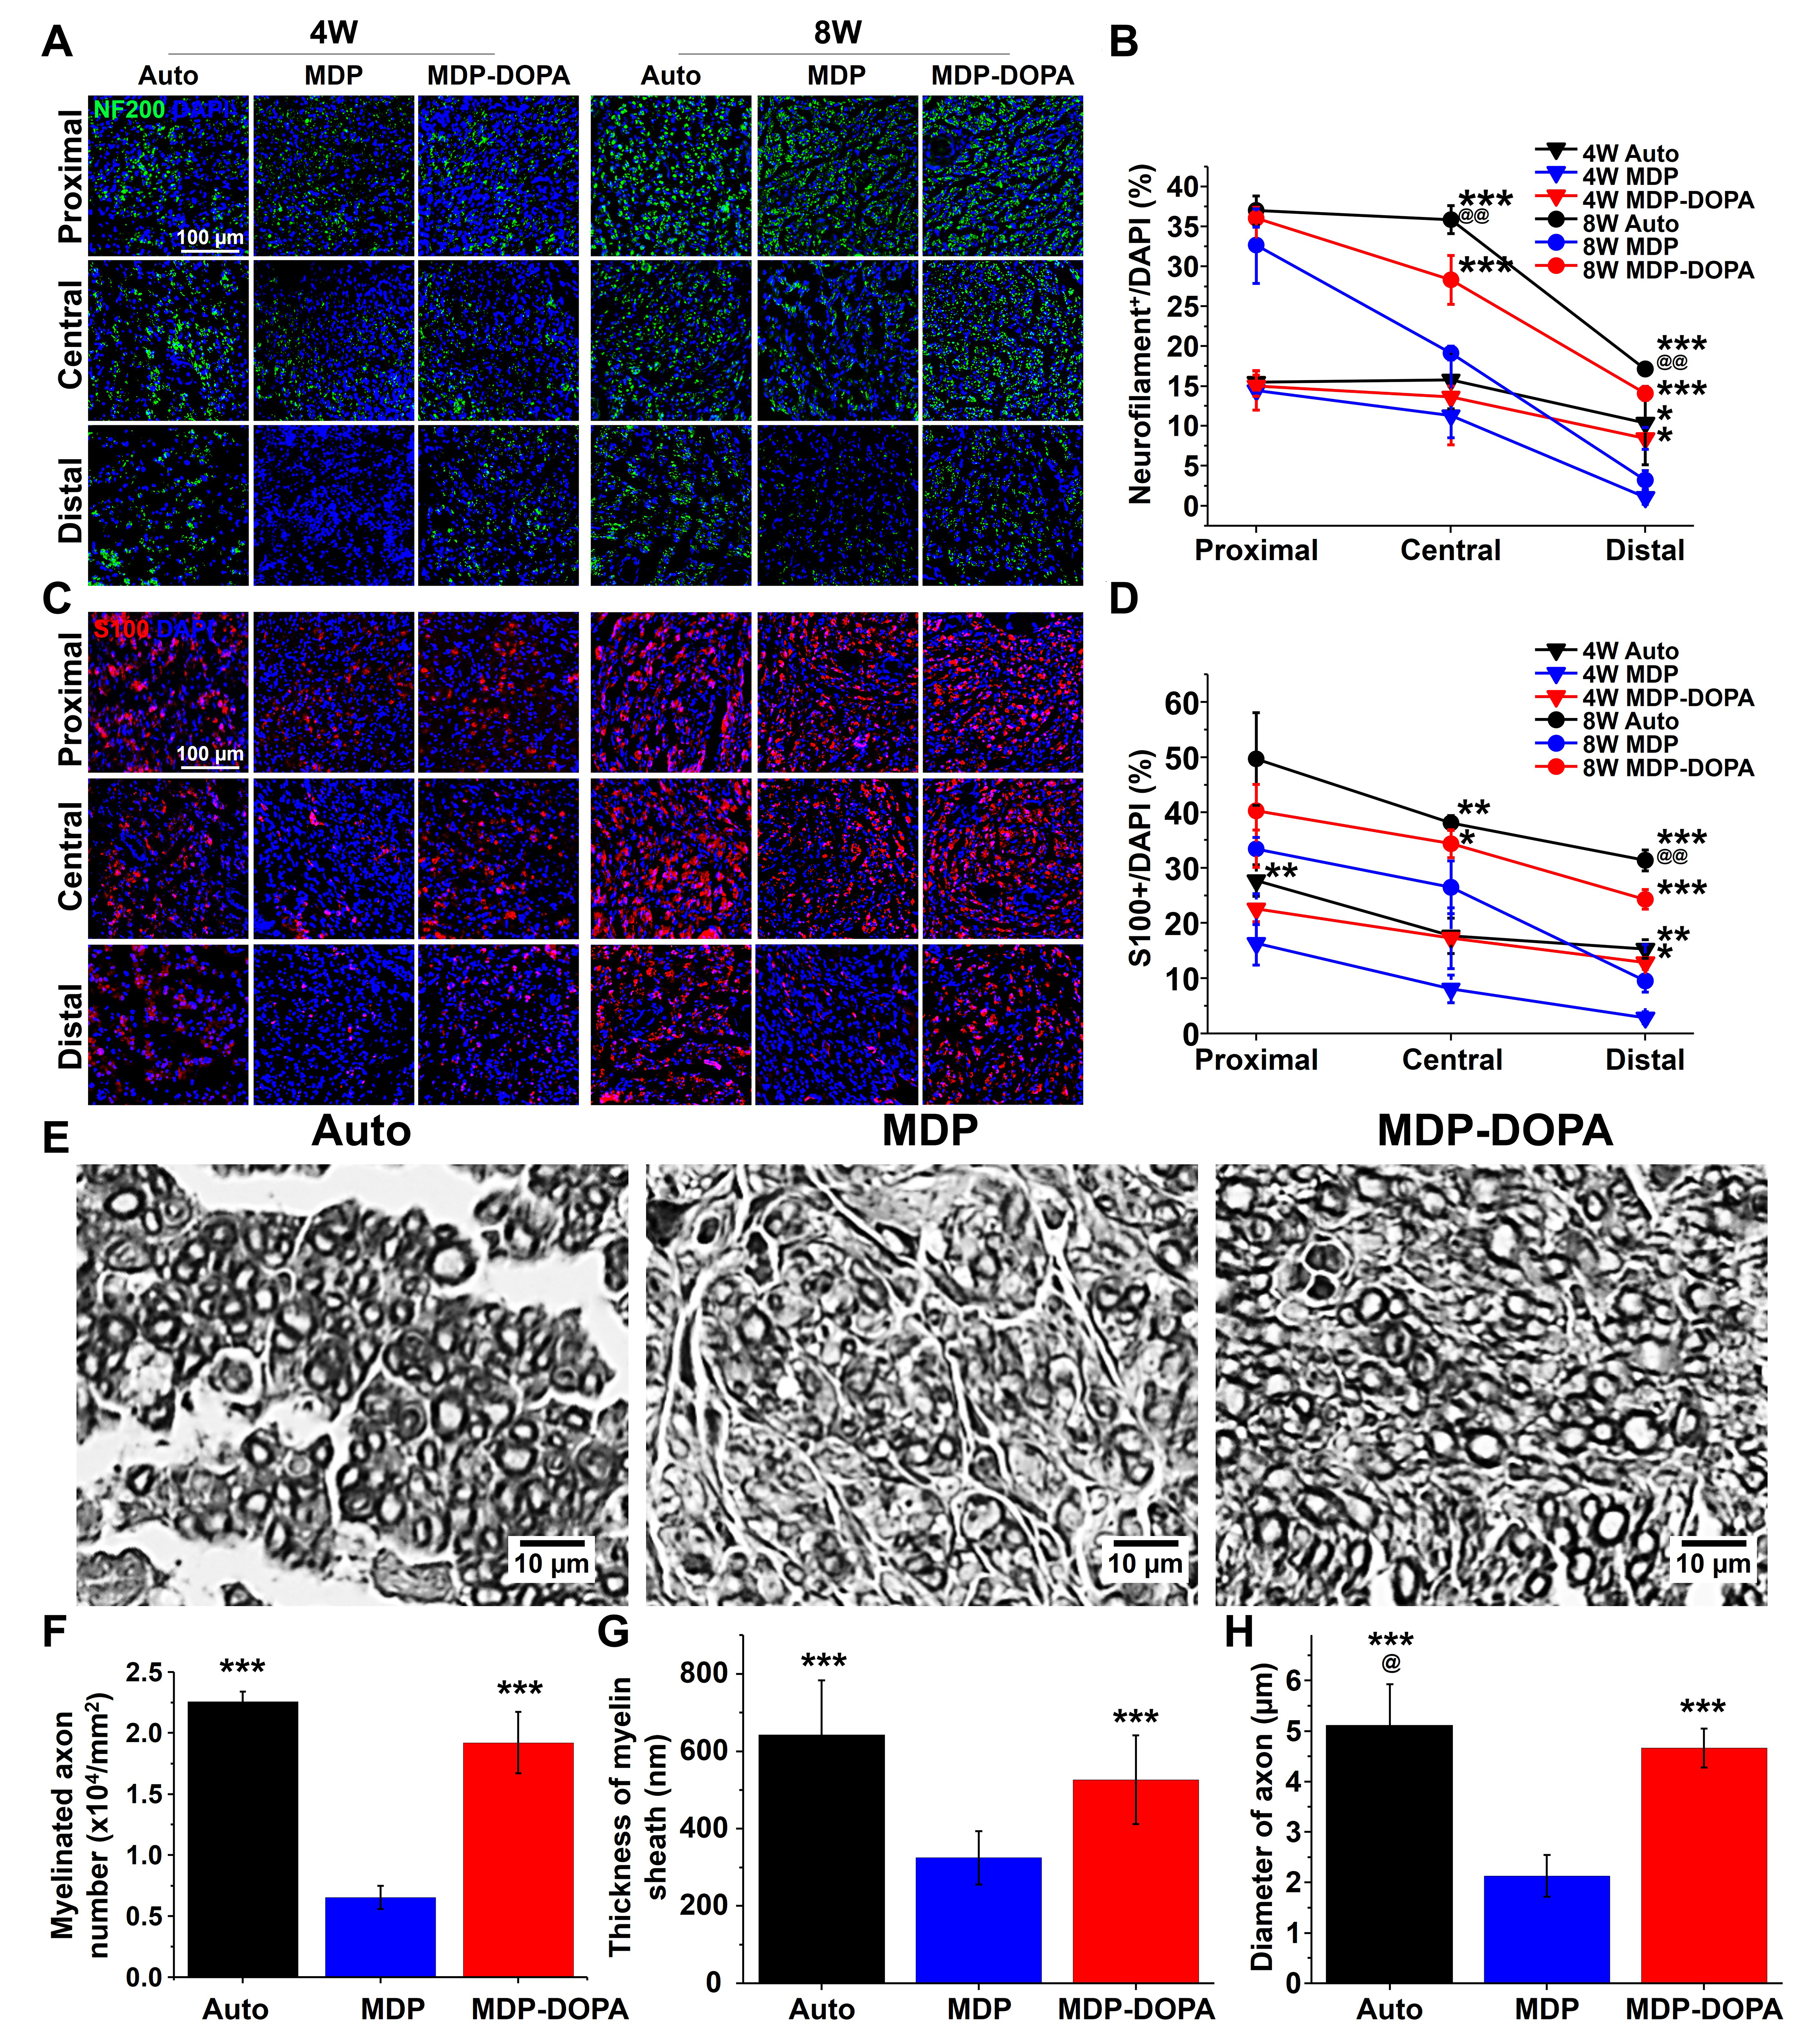
Figure 5. (A) Immunohistochemical evaluation of neurofilament 200 (NF200) expression at 4 and 8 weeks (scale bar = 100 μm); (B) Quantification of NF200 positive expression (*P < 0.05 and ***P < 0.001 vs. MDP, @@P < 0.01 vs. MDP-DOPA; statistical comparisons were conducted among groups at each time point); (C) Immunohistochemical evaluation of S100 at 4 and 8 weeks (Scale bar = 100 μm); (D) Quantification of S100 positive expression (*P < 0.05, **P < 0.01, and ***P < 0.001 vs. MDP; @@P < 0.01 vs. MDP-DOPA; statistical comparisons were conducted among groups at each time point); (E) Cross section of distal region of remyelinated nerve using osmic acid staining (Scale bar = 10 μm); Quantification results of (F) myelinated axon number, (G) thickness of myelin sheath, and (H) axon diameter (***P < 0.001 vs. MDP, @P < 0.05 vs. MDP-DOPA). All values denote the mean ± SD derived from four independent biological replicates. MDP: Milk-derived protein; DOPA: dihydroxyphenylalanine; SD: standard deviation; DAPI: 4′,6-diamidino-2-phenylindole.