


fig3
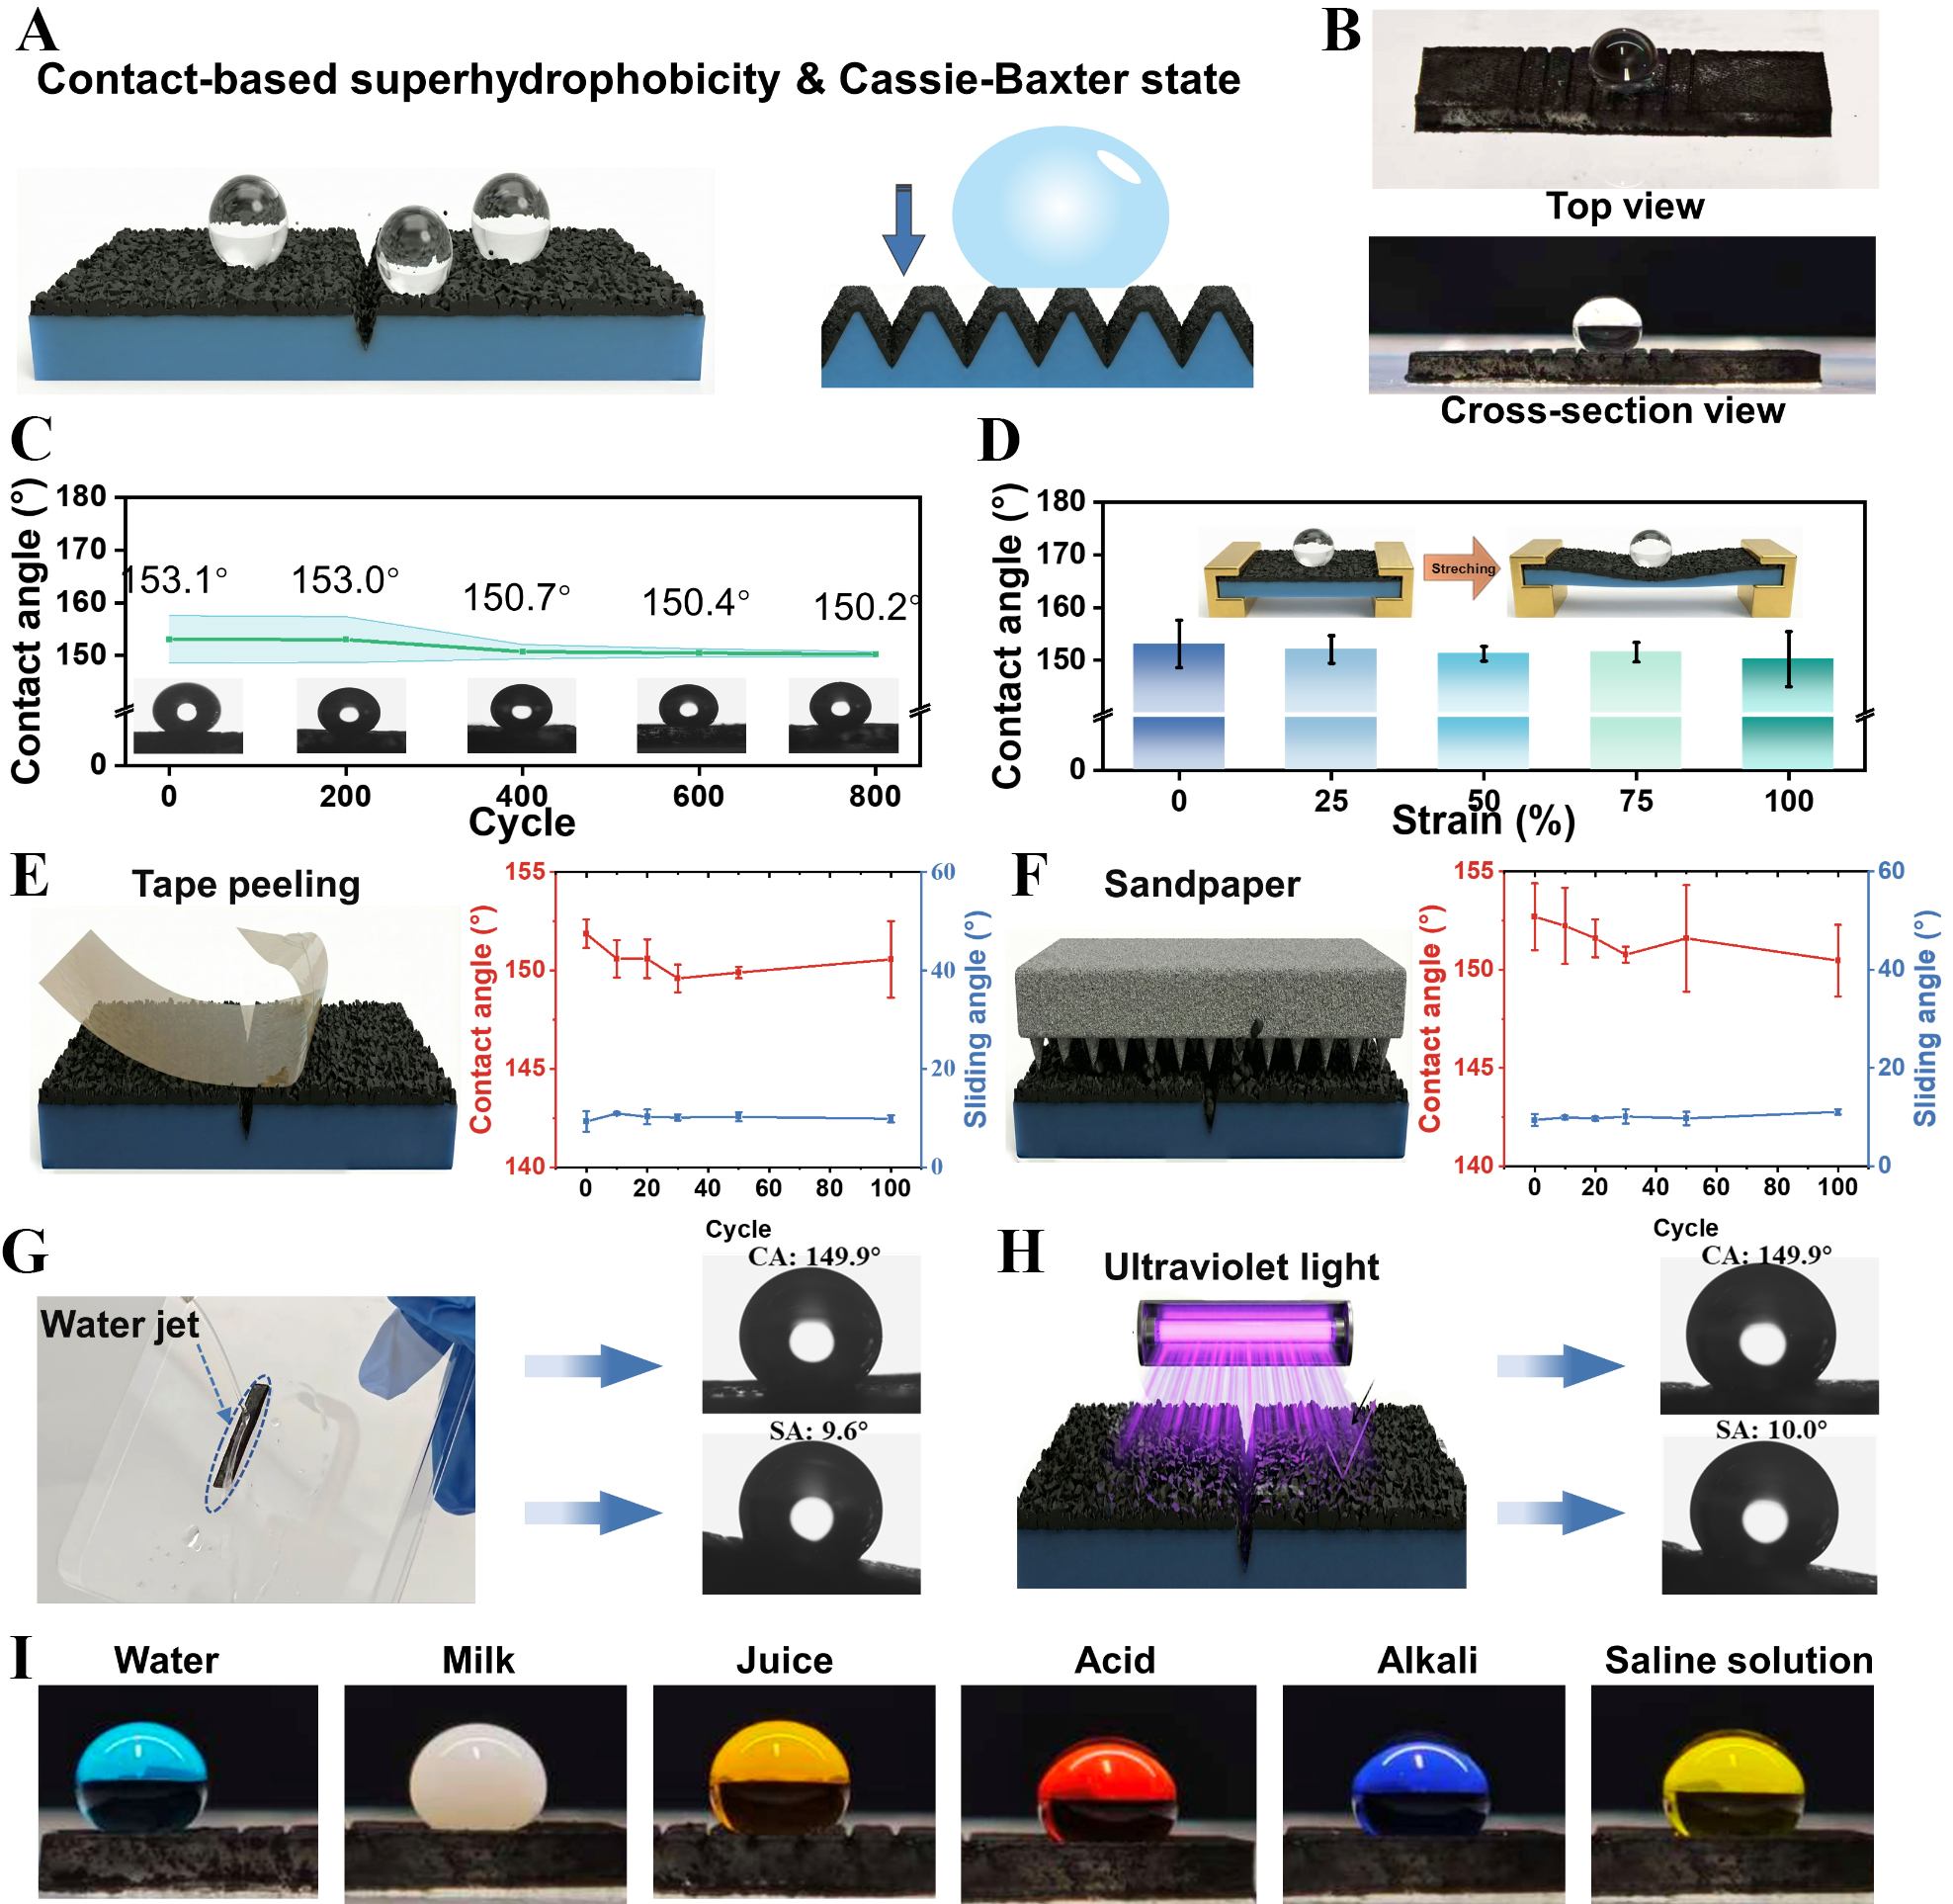
Figure 3. Characterization of the robust superhydrophobic surface and environmental durability of the proposed sensor. (A) Schematic of the superhydrophobicity and air cushion in the Cassie-Baxter state; (B) Optical images showing a water droplet residing on the sensor surface (top view) and the microscopic roughness profile (cross-sectional view); (C) Long-term durability assessment showing the evolution of the θCA over 800 bending cycles (± 60°). The values are presented as mean ± SD; N = 3; (D) Variation of the θCA under dynamic uniaxial tensile strains ranging from 0% to 100%; (E) Tape-peeling test results displaying the evolution of θCA and θSA over repeated peeling cycles. The values are presented as mean ± SD; N = 3; (F) Sandpaper abrasion test characterization showing the retention of high θCA and low θSA values against friction-induced wear. The values are presented as mean ± SD; N = 3; (G) High-speed water-jet impact test demonstrating resistance to dynamic liquid pressure, with minimal degradation in θCA/θSA values after impact; (H) UV-light irradiation test simulating resilience against long-term outdoor aging; (I) Optical images of various complex fluids, including water, milk, juice, and acid, alkali, and salt (simulating seawater) solutions, maintaining spherical shapes on the sensor surface. θCA: Contact angle; θSA: sliding angle; SD: stand deviation; UV: ultraviolet.


