


Deciphering the strength-ductility trade-off in (CuNiMn)-X alloys via interpretable machine learning
 0
0 Abstract
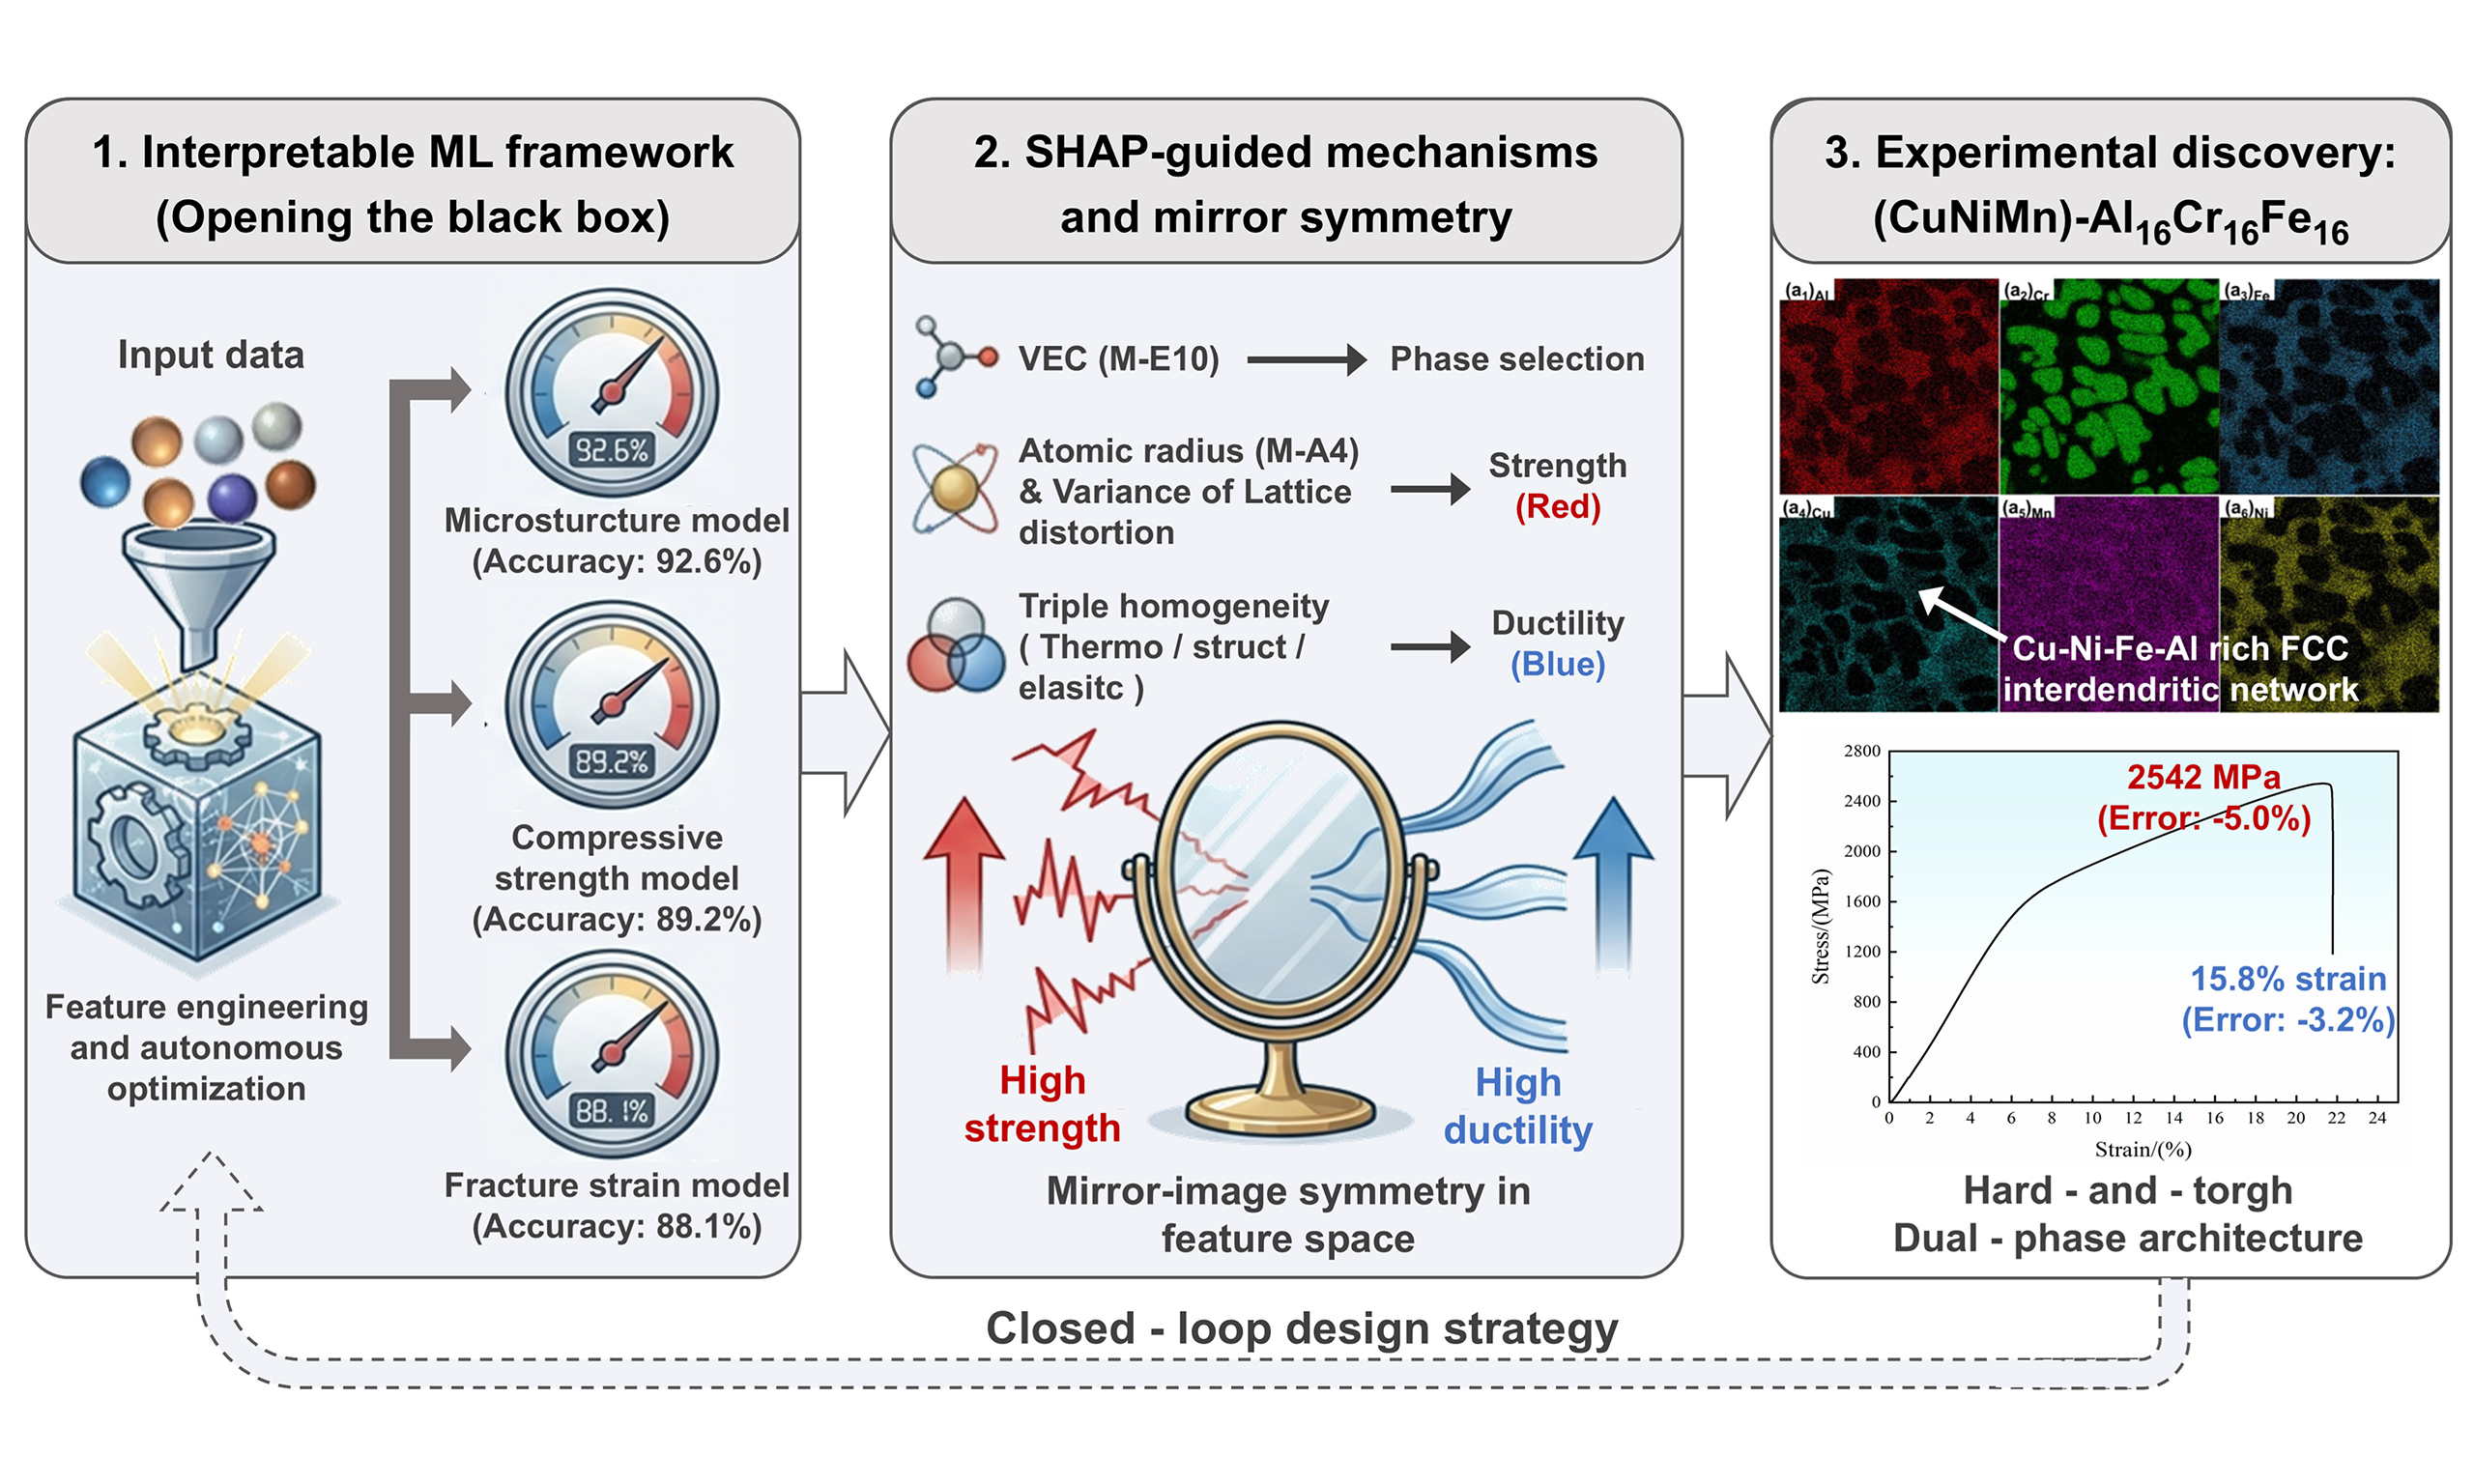
Existing machine learning-assisted alloy design studies often treat models as “black boxes”, lacking interpretability and thus failing to translate predictions into physically meaningful design guidelines. Herein, we propose an integrated strategy combining feature engineering, autonomous model optimization, and interpretability analysis for the efficient design of (CuNiMn)-X alloys, where X denotes Al, Ti, Cr, and Fe alloying elements, with strength-ductility synergy. Through feature cleaning and grid-based hyperparameter optimization, prediction accuracies of 92.6%, 89.2%, and 88.1% are achieved for the microstructure, compressive strength, and fracture strain models, respectively. Experimental validation of the optimized alloy shows errors of -5.0% for compressive strength and -3.2% for fracture strain. SHapley Additive exPlanations analysis reveals the underlying physical mechanisms: valence electron concentration (M-E10) governs phase selection; mean atomic radius (M-A4) and its variance dominate compressive strength via lattice distortion; variances of fusion enthalpy, covalent radius, and shear modulus collectively control compressive strain through triple homogeneity in thermodynamics, structure, and elasticity. This analysis unveils a mirror-image symmetry between high strength and high ductility in feature space, elucidating the strength-ductility trade-off. Guided by predictions, the (CuNiMn)-Al16Cr16Fe16 alloy is experimentally validated, exhibiting a compressive strength of 2,542 MPa and fracture strain of 15.8%. The microstructure consists of Cr-rich body-centered cubic dendrite arms and a Cu-Ni-Fe-Al-rich face-centered cubic interdendritic network, forming a hard-and-tough dual-phase architecture. This closed-loop design strategy provides a new route for the efficient discovery of CuNiMn-based multi-principal element copper alloys and offers guidance for the broader design of complex multi-principal element alloys.
Keywords
INTRODUCTION
Achieving synergy between strength and ductility in multi-principal element alloy systems has long been a central challenge in the field of structural materials[1,2]. As a typical solid-solution strengthened copper-based alloy, CuNiMn alloys have found important applications in mechanical manufacturing, marine engineering, and rail transportation[3,4]. However, conventional strengthening mechanisms - such as solid-solution strengthening, precipitation strengthening, and work hardening - are often accompanied by a loss of ductility, giving rise to the well-known strength-ductility trade-off[5-7]. The introduction of the high-entropy alloy concept offers a new dimension for alloy design to overcome this bottleneck: by adopting equiatomic or multi-principal element compositions, it becomes possible to tailor the microstructure and deformation mechanisms across a substantially expanded compositional space, thereby achieving synergistic property optimization[8,9].
The development of alloy design methodologies has undergone an evolution from empirical trial-and-error approaches to theoretical computations and, more recently, to data-driven strategies. Traditional empirical approaches rely heavily on the researcher’s accumulated experience and extensive experimental efforts, resulting in long development cycles and high costs, while also struggling to achieve global optimization in high-dimensional compositional spaces[10,11]. Theoretical methods such as first-principles calculations[12-14] and CALPHAD[15,16] enable predictions of phase stability and thermodynamic properties based on physical principles, yet they face challenges when applied to complex multi-principal element alloys, including high computational cost and discrepancies between actual processing conditions and equilibrium assumptions. In recent years, data-driven machine learning approaches have emerged as a promising alternative to overcome these limitations. Unlike traditional methods that rely on physical models or empirical knowledge, machine learning learns implicit “composition-structure-property” relationships from existing experimental data, enabling rapid screening of candidate materials in high-dimensional compositional spaces and significantly shortening the development cycle[17]. This approach has been successfully applied to a wide range of material systems, including copper alloys[18,19], aluminum alloys[20,21], stainless steels[22,23], and battery materials[24,25], with a primary focus on improving prediction accuracy and enabling efficient exploration of compositional spaces. For instance, Zhang et al. employed machine learning to screen key features influencing the properties of precipitation-strengthened copper alloys and successfully developed novel alloys combining high strength and high electrical conductivity[26,27]. Tan et al. integrated machine learning with precipitation phase transformation behavior to develop an ultra-high strength conductive copper alloy[28,29]. Nevertheless, most existing studies treat machine learning models as “black-box” prediction tools, with insufficient attention to the underlying physical mechanisms that govern model decisions, leading to a lack of interpretability.
The present study proposes a high-performance alloy design methodology based on a self-optimizing machine learning strategy, aiming to develop CuNiMn-X alloys with an excellent synergy of strength and ductility. In this work, the CuNiMn-X alloys are defined as CuNiMn-based multi-principal element copper alloys, in which Cu, Ni, and Mn constitute the principal compositional framework, and X represents one or more additional alloying elements selected from Al, Ti, Cr, and Fe. Therefore, the investigated alloys retain the copper-alloy design background while incorporating the multi-principal-element alloy design concept. Distinct from conventional machine learning-assisted alloy design approaches, this work is characterized by the following features. First, a systematic feature library is constructed from five dimensions - atomic structure, electronic properties, energy distribution, physical properties, and chemical reactivity - and a two-step screening strategy combining Pearson correlation analysis and recursive feature elimination is employed to establish an efficient mapping between feature factors and target properties. Second, using support vector regression (SVR) as the base model, an autonomous model training and screening framework is developed by integrating grid-based hyperparameter optimization with a 100-fold random splitting strategy, thereby circumventing the subjectivity inherent in manual parameter tuning. Third, the SHapley Additive exPlanations (SHAP) interpretability framework is applied to elucidate the underlying physical mechanisms by which key features influence the microstructure, compressive strength, and compressive fracture strain, and to clarify the essential origin of the strength-ductility trade-off from a feature attribute perspective. Finally, based on the optimal model, high-throughput composition prediction and Pareto optimization are performed, followed by experimental validation of the screened optimal alloy composition. This establishes a closed-loop design workflow encompassing data collection, feature engineering, model construction, interpretability analysis, and experimental verification, offering a new paradigm for the efficient and precise design of high-performance copper alloys.
MATERIALS AND METHODS
Framework for alloy design
To achieve rapid compositional screening and performance optimization of high-performance CuNiMn-based multi-principal element copper alloys, namely CuNiMn-X alloys, where X represents one or more additional alloying elements selected from Al, Ti, Cr, and Fe, this work proposes a machine learning-based design strategy. Driven by a data-centric workflow, the strategy comprises three sequential stages: data reconstruction and feature cleaning, model construction and screening, and alloy design and experimental validation.
Data reconstruction and feature cleaning
A dataset comprising 1,340 entries was compiled from published literature, encompassing alloy compositions, phase types, compressive strength, and fracture strain for alloys fabricated by vacuum arc melting. To ensure consistency in processing conditions, only vacuum-arc-melted alloys were included, and heat-treated data were excluded. The detailed source references and original data entries are provided in Supplementary Annex 1. The nominal alloy formula ratios were normalized into atomic fractions before feature construction and model training. To clarify the compositional coverage and applicability domain of the machine learning models, the atomic fraction ranges and occurrence frequencies of the constituent elements are summarized in Supplementary Table 1. In addition, the phase-type distribution of the dataset is summarized in Supplementary Table 2. The dataset contains 595 body-centered cubic (BCC) samples, 495 face-centered cubic (FCC) samples, and 250 BCC+FCC samples, corresponding to 44.4%, 36.9%, and 18.7% of the total dataset, respectively. The dataset mainly includes Cu-Ni-Mn-based multi-component alloys and related multi-principal element alloys prepared under comparable casting conditions. To clarify the applicability domain of the machine learning models, the compositional boundaries of the principal elements and additional alloying elements were summarized. The base elements Cu, Ni, and Mn cover the main compositional framework of the investigated alloy system, while the additional alloying elements include Al, Ti, Cr, and Fe, which were selected as the X elements for subsequent composition screening and experimental validation. Therefore, in this work, CuNiMn-X denotes Cu-Ni-Mn-based alloys containing one or more additional alloying elements selected from Al, Ti, Cr, and Fe. The detailed compositional boundaries of the dataset are provided in Supplementary Table 1.
To transform the alloy compositions into feature descriptors that capture the intrinsic material properties, features were constructed from five dimensions - atomic structure, electronic properties, energy distribution, physical properties, and chemical reactivity - while excluding radioactive and toxic elements. A set of 25 fundamental features relevant to microstructure and mechanical properties was extracted from the Inorganic Crystal Structure Database (ICSD). Based on these elemental features and the molar fractions of constituent elements, the compositional data were further converted into 79 feature descriptors using Equations (1-3)[28].
where fm, fv and fz represent the weighted mean, weighted standard deviation, and normalized deviation of the elemental feature for the alloy, respectively; αi is the elemental property of the i-th constituent element, ci is its molar fraction, and n is the number of constituent elements in the alloy.
Given that certain features may exhibit multicollinearity[30] (i.e., two or more feature factors carry similar information), directly feeding them into a model may lead to overfitting or degraded interpretability. Therefore, based on the feature reconstruction, the Pearson correlation coefficient was employed to perform a two-step screening of the 79 feature factors, aiming to eliminate redundant features and those weakly correlated with the target variables. First, the Pearson correlation coefficient between any two feature factors X and Y was calculated using Equation (4)[31,32]. If |r| > 0.90, the two features are considered to have a strong correlation, indicating that they share similar information and contribute comparably to model construction[33]. In such cases, one of the two features was retained while the other was eliminated, resulting in a feature set in which all pairwise correlation coefficients are below 0.90, as shown in Figure 1.
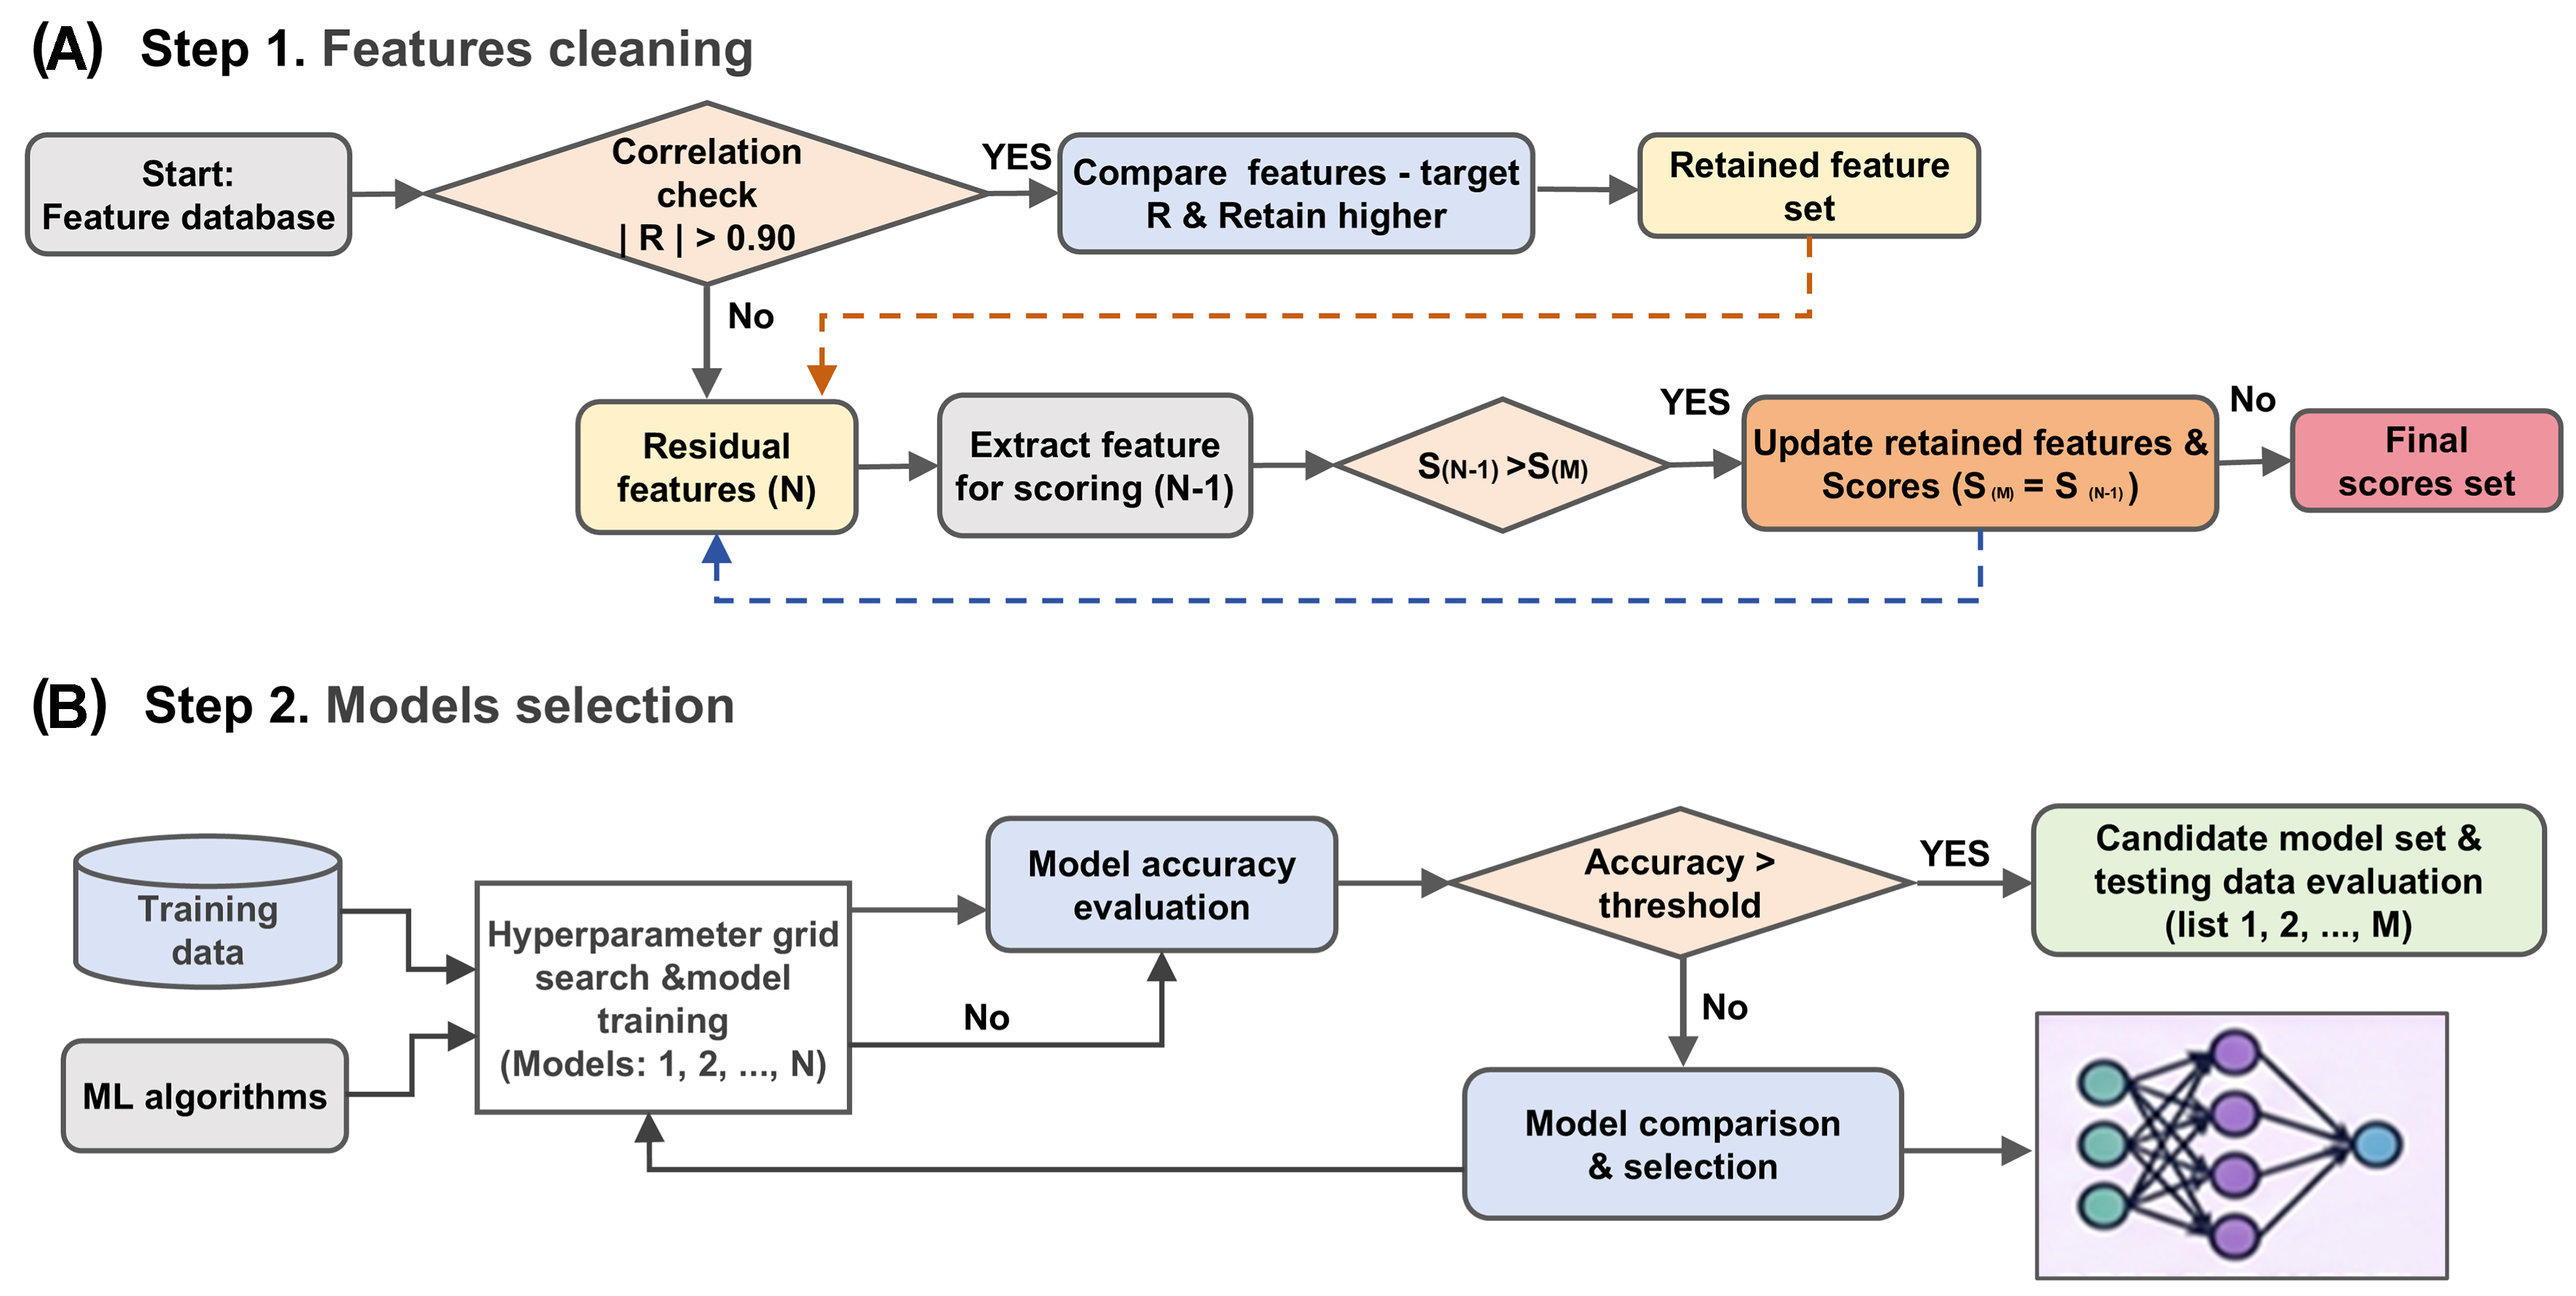
Figure 1. The processing of (A) features cleaning and (B) model selection. ML: Machine learning.
Since the first screening only eliminates redundancy among features, the remaining feature set may still contain multiple features with varying degrees of correlation with the target variables - namely, phase type, compressive strength, and fracture strain. To further refine the feature set and reduce data interference, a second screening step was performed: the Pearson correlation coefficient between each remaining feature and the target variables was calculated, and only those features exhibiting a relatively high correlation were retained. This ensures that each core attribute is represented by a single feature in the final feature set.
Following the Pearson correlation-based screening, recursive feature elimination was further employed to refine the feature set and obtain the optimal feature subset, enabling an effective description of the mapping between features and alloy properties. Using a random forest as the base model, a 10-fold cross-validation method combined with Equation (5) was applied to evaluate the impact of different feature combinations on model prediction accuracy[28]. In each iteration, the model was trained on the current feature set, the importance scores of the features were calculated, and the least important feature was eliminated. This process was repeated on the remaining feature set. By traversing all feature subsets and recording the average cross-validation score at each iteration, the feature subset that yielded the optimal model performance was selected as the final feature set.
where MAPE is the true average error of the model, N is the total number of datasets, and Vpred and Vexp represent the predicted and experimental values of the data, respectively, The feature number-model accuracy curve and the feature importance curve were subsequently constructed, and the combination of key feature factors that has the greatest impact on the target was selected based on the highest model accuracy.
Model construction and screening
To obtain the optimal machine learning models, support vector machine-based algorithms with a radial basis function (RBF) kernel were employed. Specifically, support vector classification (SVC) was used for phase-type prediction because the phase output is categorical, including BCC, BCC+FCC, and FCC, whereas SVR was used for the prediction of compressive strength and fracture strain. To justify the model selection, random forest models were additionally introduced as benchmark models, including a random forest classifier (RFC) for phase-type prediction and random forest regressors (RFR) for compressive strength and fracture strain prediction. Hyperparameter search was performed using grid-based optimization, followed by model training and screening[26].
To avoid the randomness associated with a single data split, a random partitioning strategy was repeated 100 times. In each iteration, the dataset was randomly divided into training (80%) and test (20%) sets using distinct random seeds to ensure independence of the splits. For a fair comparison, the SVR-RBF and random forest models were evaluated using the same optimized feature subsets, the same training/test splitting strategy, and the same evaluation metrics. Given the sensitivity of SVC/SVR to feature scales, normalization was applied to both the training and test sets, mapping feature values to the interval. The scaling parameters were fitted only on the training set and subsequently used to transform the test set, thereby preventing information leakage. The hyperparameter search ranges were determined based on prior knowledge and preliminary experiments: the penalty coefficient C was set to range from 10 to 2,000, and the kernel parameter Gamma ranged from 1 to 3[27]. For each random split, all combinations of C and Gamma were exhaustively traversed, and the SVR model was trained and evaluated on the test set using the coefficient of determination (R2), and prediction accuracy as performance metrics[28]. To avoid overfitting or underfitting and to efficiently identify models with robust generalization capability, a screening criterion was established: the test-set R2 should be higher than 0.75, and the training-set R2 should be higher than the test-set R2. Models meeting these criteria were considered valid, and their corresponding random seeds and hyperparameter combinations were recorded. After traversing all 100 random seeds and hyperparameter combinations, the model with the highest test-set R2 was selected as the final optimal model for subsequent composition prediction. It should be noted that the reported optimal accuracies correspond to the selected seed/hyperparameter combinations rather than the average values of all random splits. To evaluate whether the selected model was affected by a “lucky split”, the mean value and standard deviation of the prediction metrics over the 100 independent random splits were further calculated and reported as indicators of model stability. Using the trained optimal model, grid-based predictions were performed on unexplored compositional spaces to generate composition–property maps, enabling the identification of target alloys.
Here, R2 represents the coefficient of determination, with values approaching unity indicating a better goodness-of-fit of the model; Acc denotes the prediction accuracy, where higher values correspond to stronger predictive capability; N is the number of data points in the model architecture, mm is the number of samples, and Vpred and VExp are the predicted and experimental values of the samples, respectively.
For the phase-type model, the output is categorical rather than continuous. Therefore, the phase prediction task was treated as a multi-class classification problem with three classes: BCC, BCC+FCC, and FCC. The trained classifier outputs the predicted probabilities of the three phase classes. SHAP analysis was then implemented on the class probability outputs rather than on the discrete phase labels. For each phase class, SHAP values were calculated in a one-vs-rest manner. A positive SHAP value for a given class indicates that the feature increases the predicted probability of that class relative to the baseline probability, whereas a negative SHAP value indicates that the feature decreases the predicted probability of that class. This class-specific probability-based interpretation avoids treating the categorical phase label as a continuous variable.
Experimental validation
To validate the accuracy of the model predictions, a series of CuNiMn-X alloys were prepared using a vacuum arc melting furnace, followed by microstructural characterization and mechanical property testing. High-purity Cu, Ni, Mn, Al, Cr, and Fe raw materials with purities higher than 99.9 wt.% were used as starting materials. The weighed raw materials were melted under a high-purity argon atmosphere, and the alloy ingots were flipped and remelted 5 times to improve chemical homogeneity.
Vickers hardness measurements were conducted using an HXD-1000T hardness tester under a load of 500 g with a dwell time of 15 s. For each specimen, five indentations were made in a cross-shaped pattern to obtain an average hardness value. Compression test specimens were machined into cylinders with dimensions of
RESULTS AND DISCUSSION
Data cleaning and selection of key feature factors
Figure 2A-C present heat maps of the correlation coefficients among the selected feature factors after correlation-based screening. In these maps, the pie size represents the absolute value of the correlation coefficient, with red indicating positive correlation and blue indicating negative correlation. During the screening process, when the absolute value of the correlation coefficient between any two feature factors exceeded 0.90, the two factors were considered to be strongly correlated, implying that they contain similar information and contribute comparably to model construction[33]. In such cases, the feature factor showing a stronger correlation with the target variable - namely, phase type, compressive strength, or fracture strain - was retained, while the other was eliminated. Following this screening, 17 feature factors associated with microstructure [Figure 2A], 24 with compressive strength [Figure 2B], and 27 with fracture strain [Figure 2C] were obtained, with all remaining features being mutually independent.
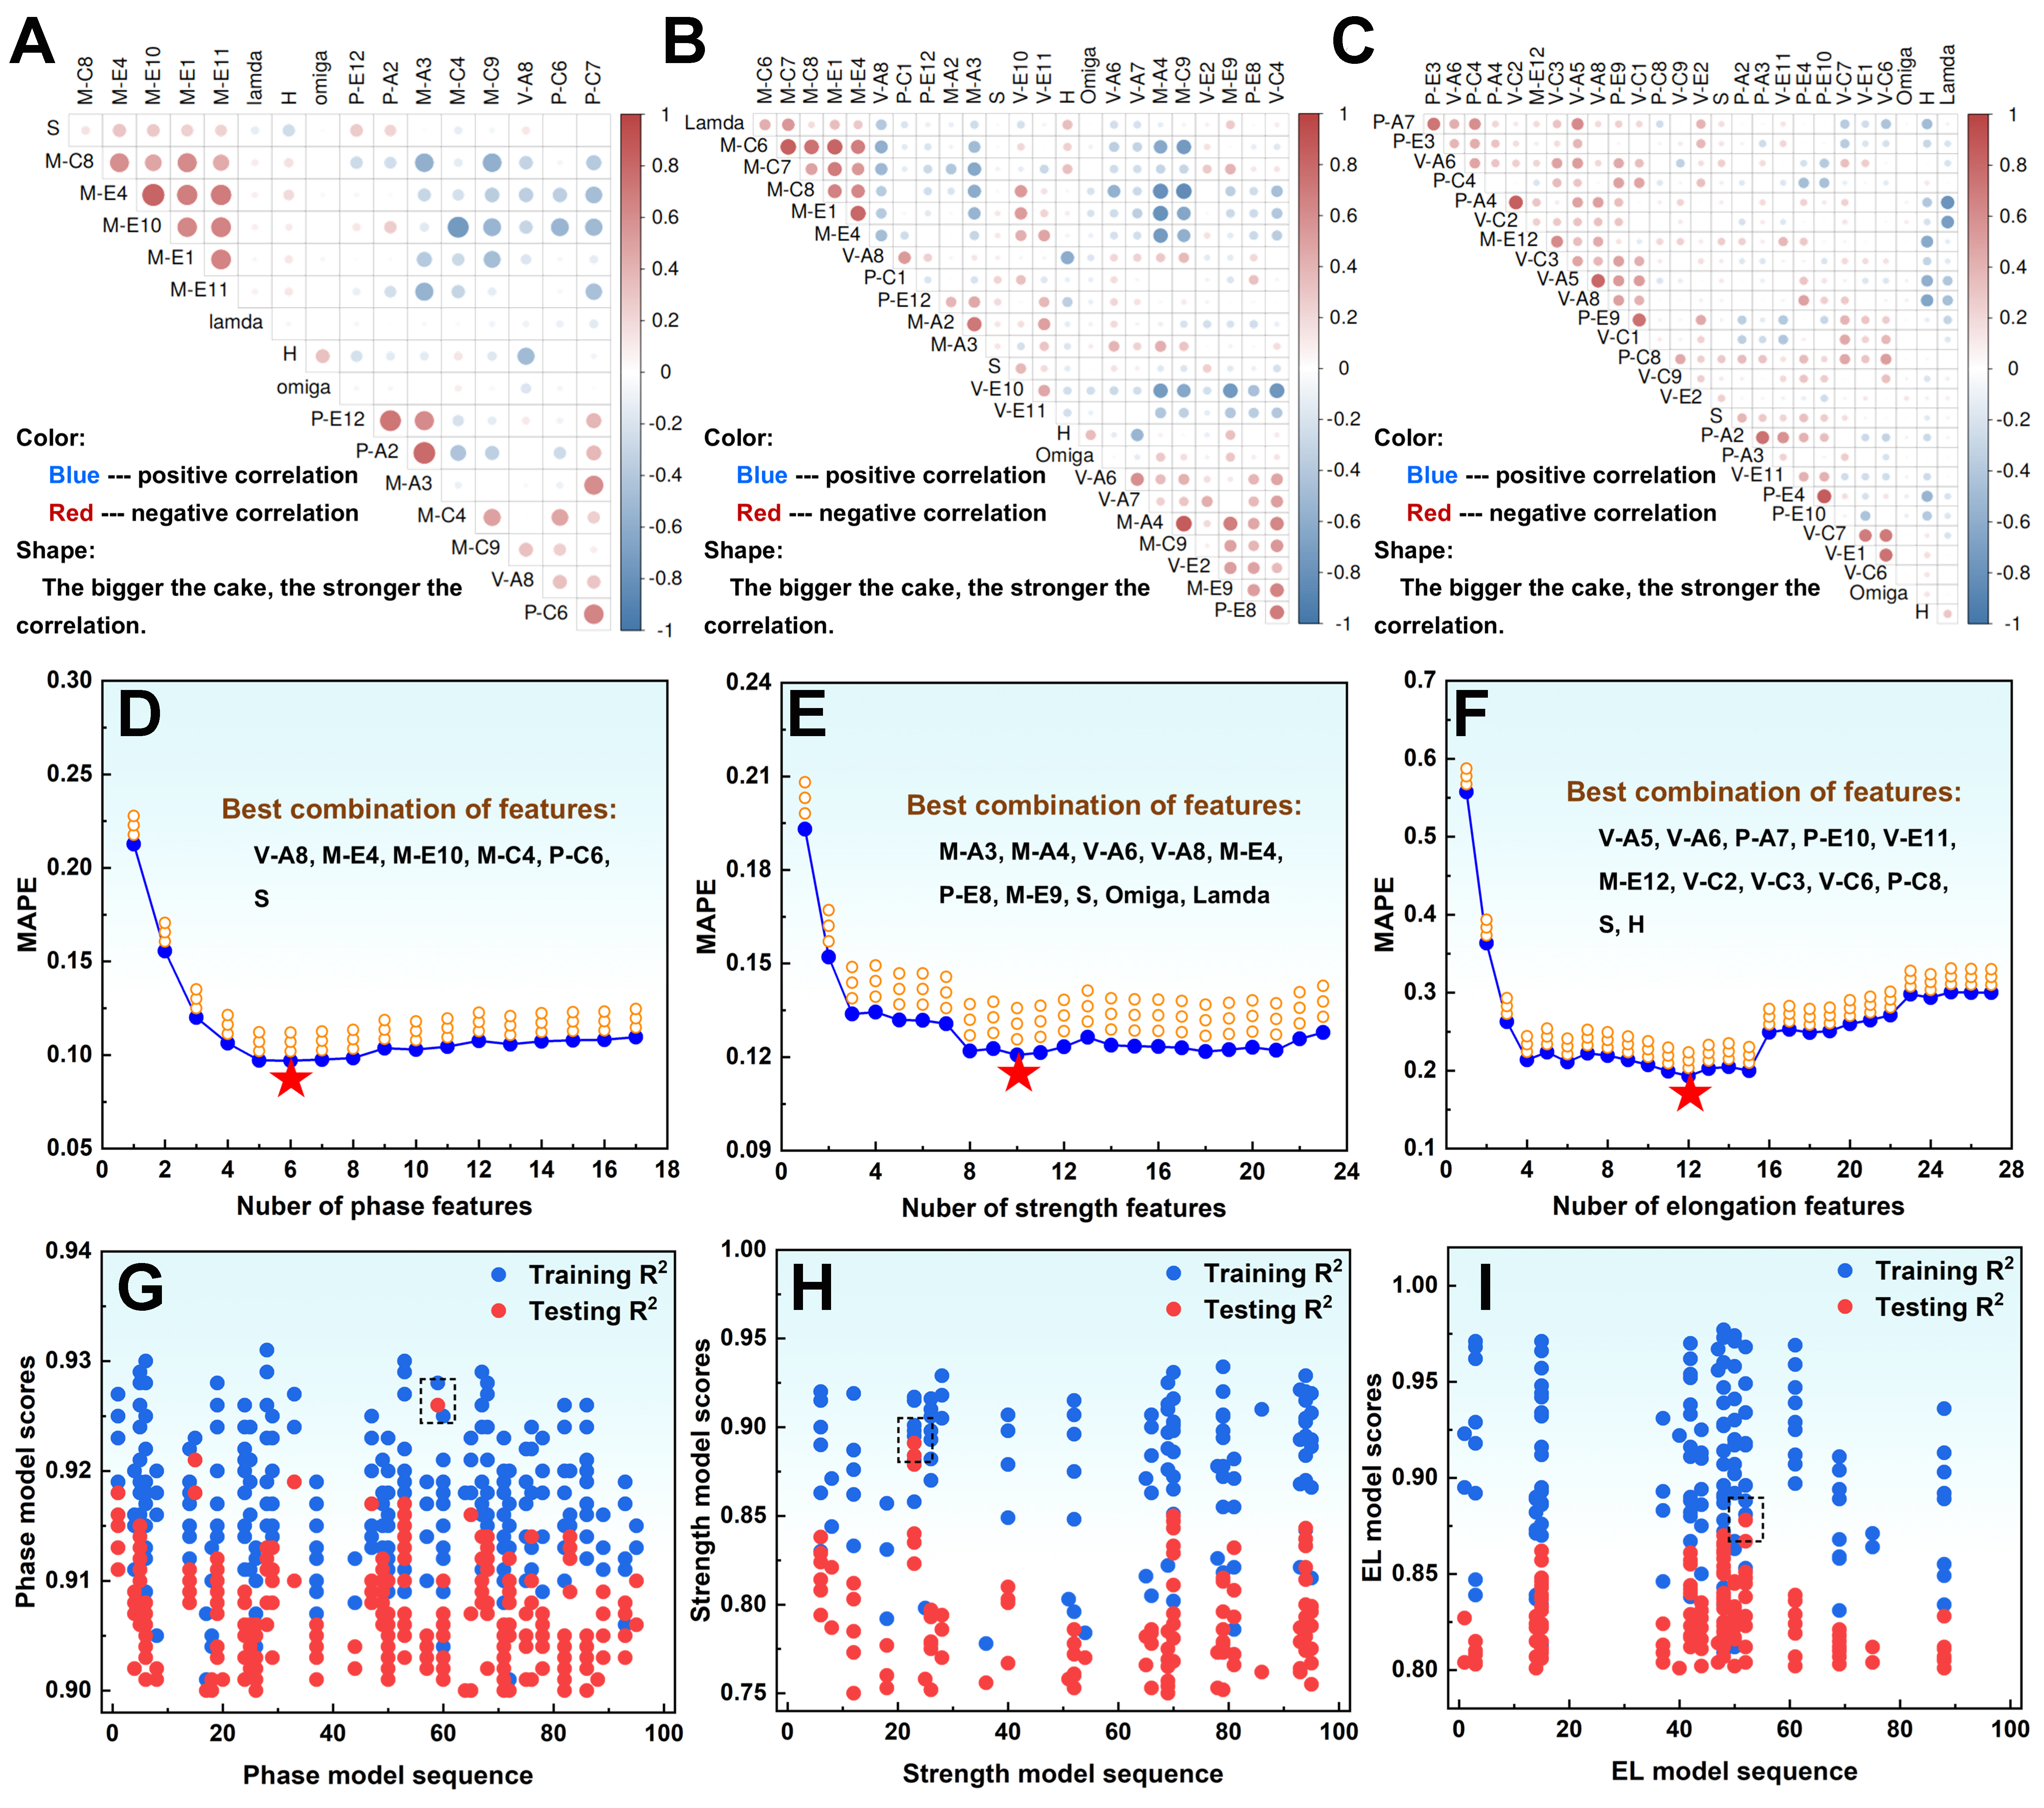
Figure 2. Feature selection results: feature correlation coefficients (A-C), recursive feature elimination results (D-F), and feature importance rankings (G-I) for phase type/microstructure (A, D, G), compressive strength (B, E, H), and fracture strain (C, F, I). MAPE: Mean absolute percentage error; R2: coefficient of determination; EL: compression deformation rate.
Figure 2D-F present the evolution of model prediction accuracy during the recursive feature elimination process. It can be observed that as the elimination proceeds, the model error first decreases and then increases. This trend indicates that in the initial stage of elimination, the removed feature factors have a relatively minor impact on the target variables - namely, microstructure, compressive strength, or fracture strain - and carry little critical information; removing these low-contribution features helps improve model prediction accuracy and generalization capability. As the elimination enters the intermediate stage, the model error reaches its minimum, indicating that the feature subset retains all essential information while eliminating redundant interference, achieving an optimal balance. Further reduction of feature factors begins to remove core features, leading to loss of critical information and a consequent decline in model generalization. Through 10-fold cross-validation evaluation, the model error was found to be minimized when the number of microstructure-related features was reduced to six, strength-related features to ten, and fracture strain-related features to twelve. The optimal feature combinations after screening, along with their physical descriptions, are summarized in Table 1.
Main alloy factors affecting properties of alloy
| Phase types | Compression strength | Compression strain | |||
| Factors | Description | Factors | Description | ||
| V-A8 | Vanderwaals radius | M-A3 | Lattice constant C | V-A5 | Atomic radius |
| M-E4 | Absolute electronegativity | M-A4 | Atomic radius | V-A6 | Covalent radius |
| M-E10 | Valence electron | V-A6 | Covalent radius | P-A7 | Cordero covalent radius |
| M-C4 | Enthalpy of vaporization | V-A8 | Vanderwaals radius | P-E10 | Valence electron |
| P-C6 | Young’s modulus | M-E4 | Absolute electronegativity | V-E11 | Electronic affinity |
| S | Entropy of mixing | P-E8 | Electron binding energies | M-E12 | Resistivity |
| M-E9 | Nuclear charge number | V-C2 | Molar Volume | ||
| S | Mixed entropy | V-C3 | Enthalpy of Fusion | ||
| Omiga | Comprehensive effect of enthalpy and entropy | V-C6 | Young’s modulus | ||
| Lamda | Geometric parameters | P-C8 | Shear modulus | ||
| S | Mixed entropy | ||||
| H | enthalpy of mixing | ||||
Using the optimal feature combinations obtained from the above screening, model training and selection were performed, with the results shown in Figure 2G-I. By further setting accuracy thresholds for the microstructure, compressive strength, and fracture strain models at 90%, 75%, and 80%, respectively, 285 microstructure models, 109 compressive strength models, and 137 fracture strain models were screened. The distribution of model accuracy on the validation set reveals that the accuracy of the microstructure models [Figure 2G] mainly lies in the range of 90%-93%, that of the compressive strength models [Figure 2H] mainly in the range of 75%-95%, and that of the fracture strain models [Figure 2I] mainly in the range of 80%-95%. This distribution indicates that all three types of models achieve a high level of predictive performance, with the microstructure models exhibiting the highest stability, while the mechanical property models show a broader accuracy range, consistent with the physical nature that mechanical properties are influenced by a greater number of complex factors. Based on these results, the models with the best performance on the test set were selected as the final optimal models for subsequent composition prediction. The highest accuracies achieved by the selected optimal models were 92.6% for the microstructure model, 89.2% for the compressive strength model, and 88.1% for the fracture strain model. To further justify the selection of the SVM/SVR-RBF models, random forest models were used as benchmark algorithms for comparison. The regression performance over 100 independent random train/test splits is summarized in Supplementary Table 3. For compressive strength prediction, the SVR model achieved an optimal accuracy of 89.2%, a mean R2 of 83.9%, and a standard deviation of 2.41%, whereas the RFR achieved an accuracy of 83.9%, a mean R2 of 72.0%, and a standard deviation of 6.01%. For fracture strain prediction, the SVR model also outperformed the RFR, achieving an optimal accuracy of 88.1%, a mean R2 of 82.6%, and a standard deviation of 1.85%, compared with 80.8%, 73.6%, and 7.38% for the RFR, respectively.
The classification performance of the phase prediction models is summarized in Supplementary Table 4. The SVC model achieved an accuracy of 91.34% ± 1.19%, precision of 91.75% ± 1.58%, recall of 91.14% ± 1.83%, macro F1-score of 91.37% ± 1.63%, and weighted F1-score of 93.29% ± 1.22%, all of which are higher than those of the RFC. These results demonstrate that the SVM/SVR-RBF models provide better overall prediction accuracy and stability for the present dataset. The corresponding confusion matrix is shown in Supplementary Figure 1, indicating that most samples are correctly classified into their respective phase categories, with only limited misclassification occurring near the BCC/FCC transition region. Therefore, SVC-RBF was selected for phase-type classification, while SVR-RBF was selected for compressive strength and fracture strain prediction.
Selection of alloying elements
Based on the constructed and optimized model described above, composition–property predictions were performed for the CuNiMn-X alloy system, where X represents one or more additional alloying elements selected from Al, Ti, Cr, and Fe. To improve the reproducibility of the high-throughput screening process, the compositional search space and elemental step size were explicitly defined. Specifically, Al, Ti, Cr, and Fe were varied within the ranges of 0-16 at.%, respectively, with a step size of 4 at.% for each alloying element. For each generated composition, the total atomic percentage was normalized to 100 at.%, and the trained machine learning models were used to predict the corresponding phase type, compressive strength, and fracture strain. This grid-based strategy enabled systematic exploration of the CuNiMn-X compositional space and identification of candidate alloys with balanced strength and ductility.
Figure 3 presents three-dimensional visualization maps of compressive strength and fracture elongation in the multi-dimensional compositional space. It can be observed that the CuNiMn-X alloy system exhibits a remarkably wide strength range, spanning from approximately 1,380 to 2,415 MPa [Figure 3A-D]. Among the alloying elements, increasing the contents of Al and Ti is the dominant factor driving the enhancement of strength; as the atomic percentage of Al increases, the alloy strength gradually rises [Figure 3A and C]. Ti also exhibits a strong strengthening effect [Figure 3D]. From a physical metallurgy perspective, this can be attributed to the considerable atomic radius differences between Al and Ti and the Cu–Ni–Mn matrix (approximately 12% for Al–Cu and 16% for Ti–Cu), which induce significant lattice distortion and give rise to a pronounced solid-solution strengthening effect[34]. Furthermore, increasing Al and Ti contents tends to stabilize BCC/B2-type ordered phases and promote the formation of intermetallic compounds in multi-component alloy systems, as reported in previous studies[34-36]. These hard phases can effectively impede dislocation motion and thus contribute to the enhancement of yield strength and compressive strength[35]. However, when their volume fraction becomes excessive, the hard and brittle phases may also serve as preferential sites for stress concentration and crack initiation, leading to a reduction in fracture strain[36,37]. In contrast, variations in the Fe and Cr contents have a relatively minor influence on strength, mainly due to the smaller atomic size differences between Fe and Cr and the Cu matrix (approximately 3% for Fe–Cu and 5% for Cr–Cu), which result in a comparatively limited solid-solution strengthening effect[36]. A comparison of the predicted fracture strain distributions [Figure 3E-H] reveals a classic strength–ductility trade-off, where the plasticity exhibits an inverse trend relative to strength. The predicted fracture strain values range from 8% to 17%, reflecting the significant role of alloy composition in modulating plastic deformation capability. As clearly shown in Figure 3E and F, superior fracture strain (dark blue regions, > 15%) is predominantly concentrated in composition ranges with low Al and low Ti contents. With increasing Al and Ti additions, the strain drops sharply to below 10%. This indicates that severe lattice distortion and the increased tendency to form hard BCC/B2 phases or intermetallic compounds impede dislocation motion and promote local stress concentration, thereby substantially sacrificing the plastic deformation capacity and work hardening rate[37]. When the Al or Ti content exceeds a certain threshold, the lattice distortion intensifies, and the stress required for dislocation slip increases markedly. Concurrently, the abundant dispersed hard and brittle phases act as dislocation annihilation sites, reducing the dislocation accumulation capability and weakening work hardening, ultimately resulting in a sharp decrease in ductility. Notably, the influence of Fe and Cr contents on fracture strain follows a different trend: in the intermediate Al/Ti composition range, appropriately increasing the Fe or Cr content helps improve the plastic behavior. For the design of novel high-performance alloys, it is essential to balance strength and plasticity when pursuing ultrahigh strength. Based on the comprehensive model predictions, a copper alloy combining both strength and ductility, namely (CuNiMn)Al16Cr16Fe16, was identified.
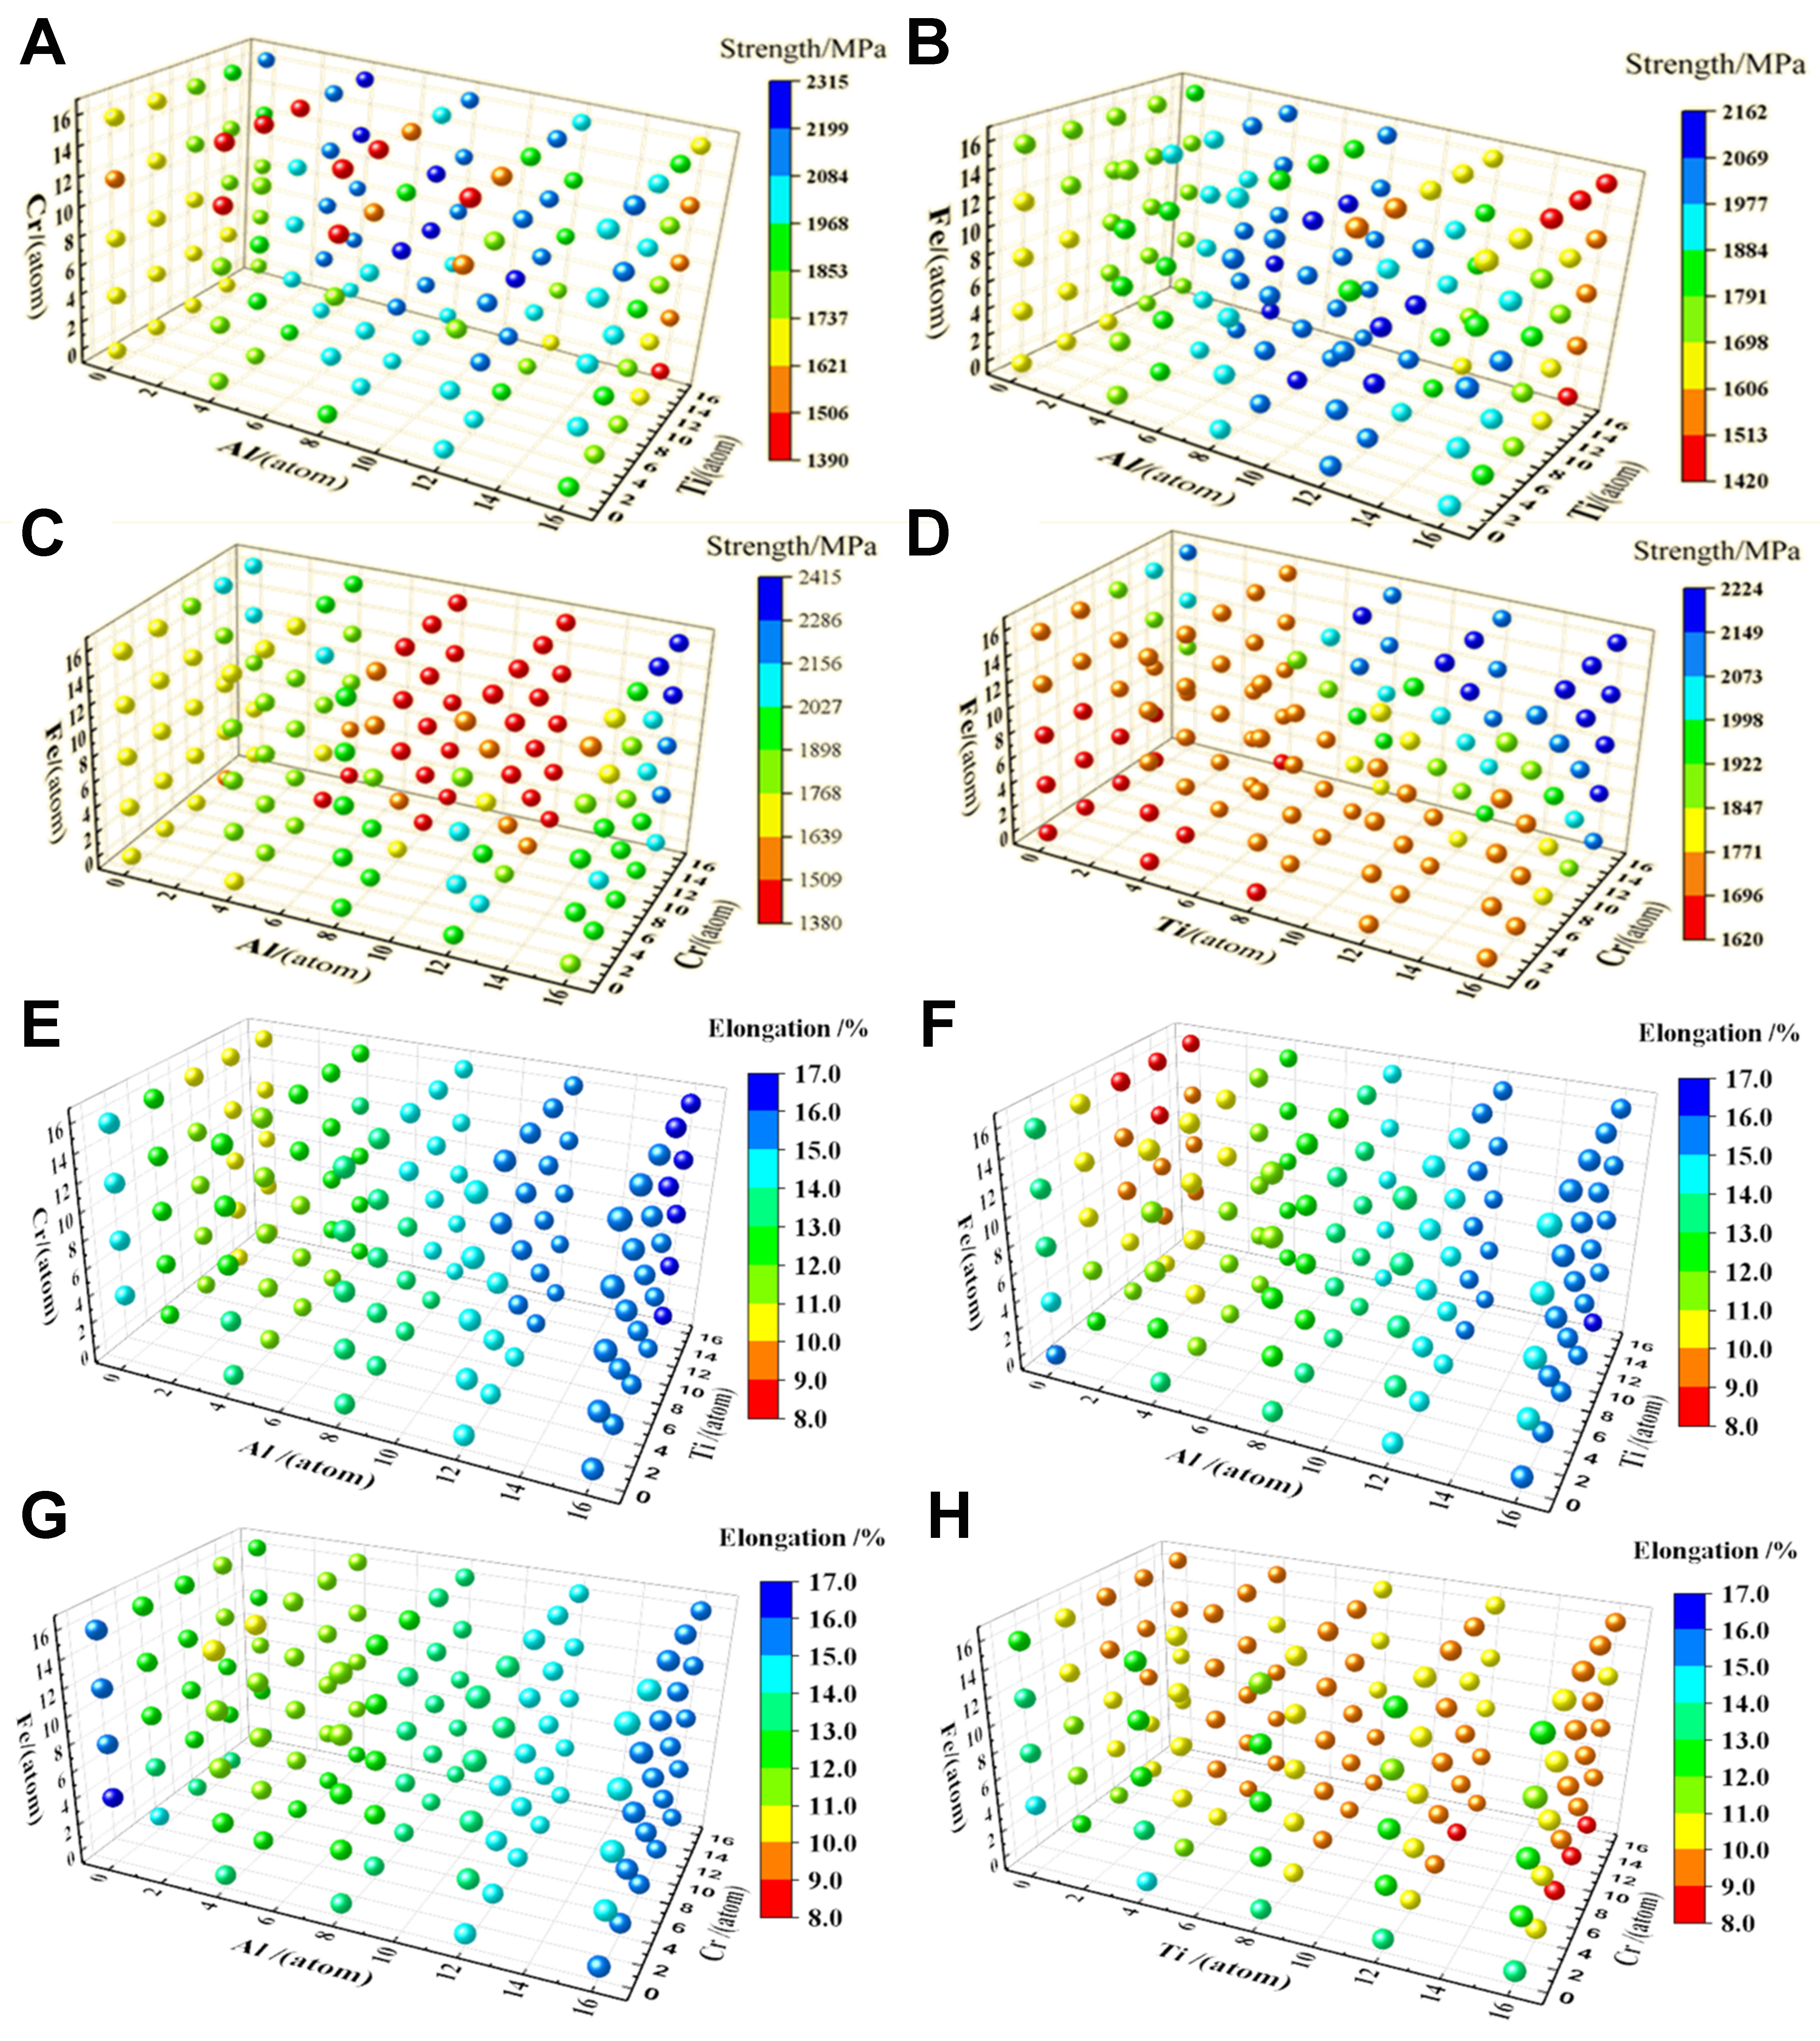
Figure 3. Model predictions for multi-component CuNiMn-X alloys. The predicted results of strength for adding of (A) Al/Cr/Ti, (B) Al/Ti/Fe, (C) Al/Cr/Fe, (D) Ti/Cr/Fe. The predicted results of compression strain for adding of (E) Al/Cr/Ti, (F) Al/Ti/Fe, (G) Al/Cr/Fe, (H) Ti/Cr/Fe.
Experimental verification
Figure 4 presents the compressive curve of the (CuNiMn)Al16Cr16Fe16 alloy. The compressive strength and fracture strain are determined to be 2,542 MPa and 15.8%, respectively. A comparison between the predicted and experimental values of compressive strength and fracture strain reveals that the predictions are in good agreement with the experimental results, with deviations of -5.0% and -3.2%, respectively. This indicates that the machine learning model exhibits a favorable optimization capability, yielding predictions that closely approximate the actual values.
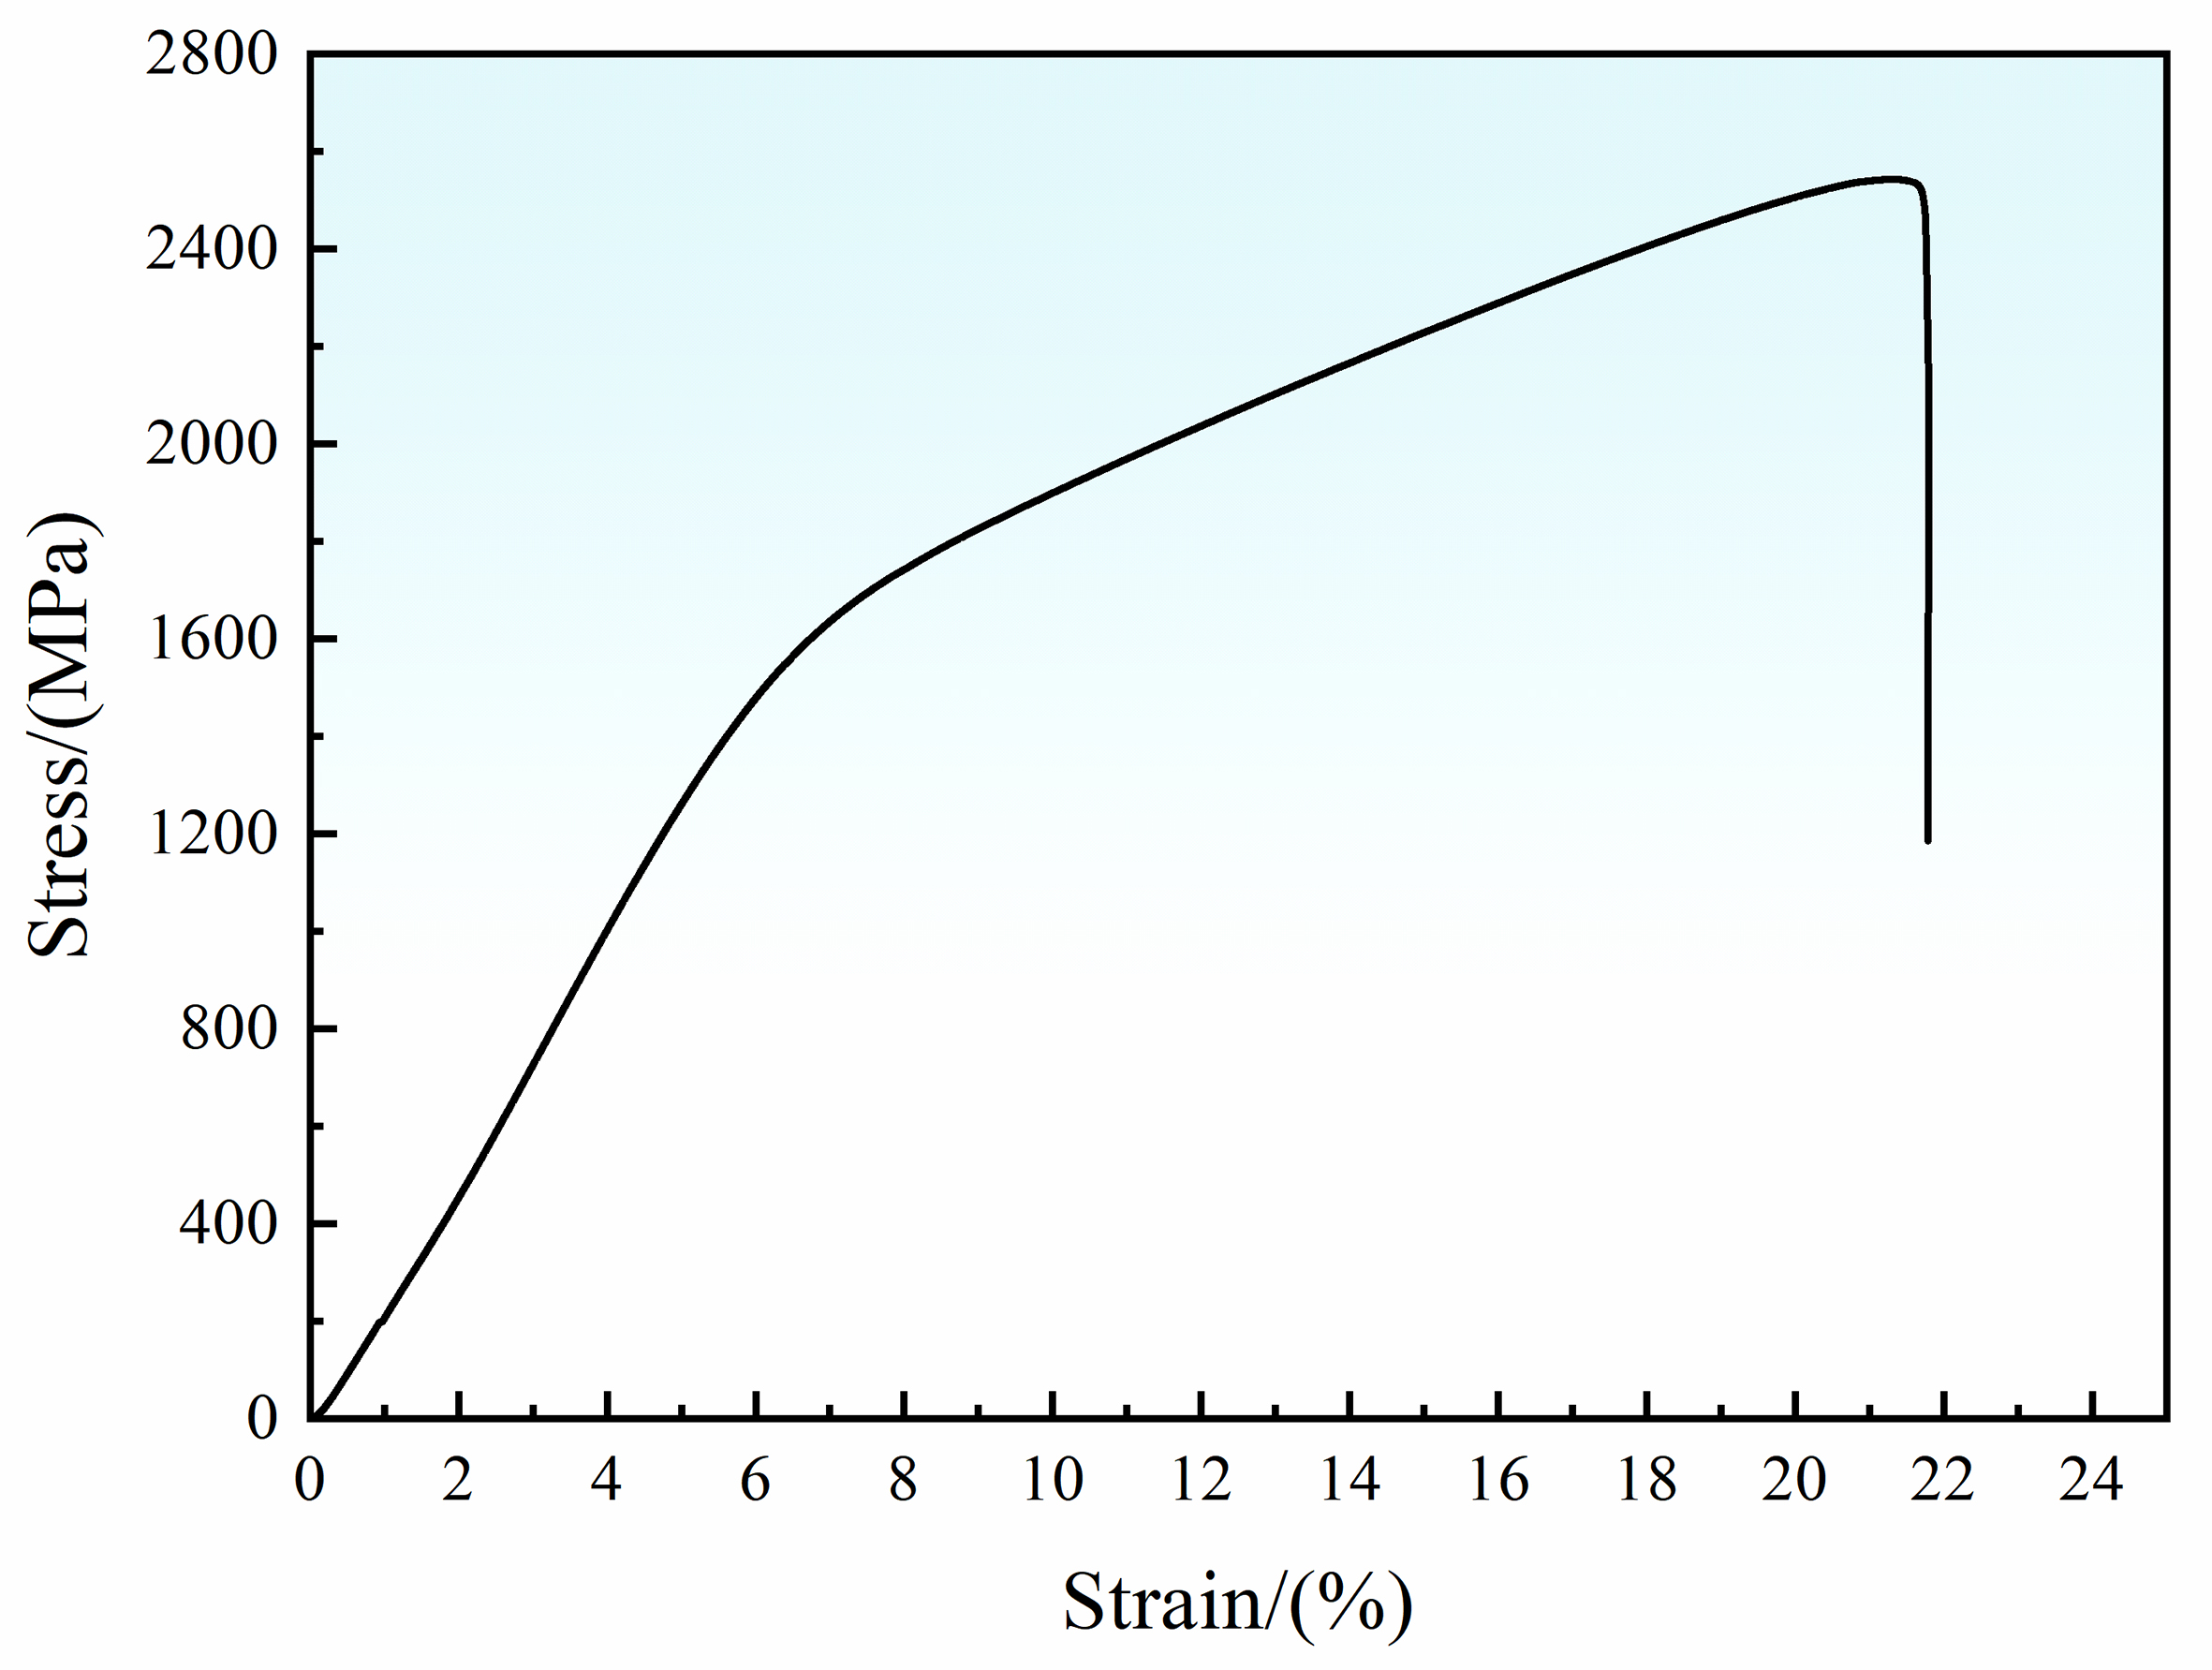
Figure 4. Mechanical properties of the (CuNiMn)-Al16Cr16Fe16 alloy.
Figure 5 presents the as-cast microstructure of a representative (CuNiMn)Al16Cr16Fe16 alloy. As shown in Figure 5A, the alloy exhibits a typical dendritic morphology, consisting of island-like/dendritic primary phases (dark regions) alternating with a continuous network of interdendritic phases (bright regions). This dendritic structure is a characteristic feature of non-equilibrium solidification, arising from compositional undercooling. Combined with the energy dispersive X-ray spectroscopy (EDS) elemental mapping results [Figure 5A1-A6], significant elemental partitioning can be observed. The high-melting-point element Cr is enriched in the dendrite core regions, while Cu, Ni, Fe, and Al are segregated to the interdendritic regions. This partitioning behavior is primarily governed by differences in the thermodynamic enthalpy of mixing among the constituent elements - the positive enthalpy of mixing between Cr and Cu promotes the preferential nucleation of Cr while rejecting Cu into the liquid phase; concurrently, the strongly negative enthalpy of mixing between Ni and Al facilitates their combination in the residual liquid. The distribution of Mn is relatively uniform between the dendrite cores and interdendritic regions, indicating its good solubility in both FCC and BCC crystal structures and its low tendency for significant segregation. Combined with XRD analysis [Figure 5B], the phase constituents are further confirmed: the Cr-rich dendrite cores (dark regions) correspond to the BCC phase, while the Cu-Ni-Fe-Al-rich interdendritic regions (bright regions) correspond to the FCC phase. This thermodynamically driven spontaneous elemental partitioning gives rise to a dual-phase microstructure characterized by “hard BCC dendrites embedded in a tough FCC interdendritic network”. The formation of BCC and FCC phases in the (CuNiMn)-X alloy system can be controlled by regulating the type and content of the additional alloying elements. In particular, the valence electron concentration (VEC) plays a dominant role in phase selection. A relatively low VEC tends to stabilize the BCC phase, whereas a higher VEC favors the formation of the FCC phase, and an intermediate VEC range promotes the coexistence of BCC and FCC phases. Therefore, adjusting the contents of Al, Ti, Cr, and Fe provides an effective route to tune the relative fraction and spatial distribution of BCC and FCC phases. In addition to VEC, electronegativity, interatomic bonding energy, atomic-size mismatch, and thermodynamic interactions also influence phase stability and elemental partitioning. For the present (CuNiMn)-Al16Cr16Fe16 alloy, Cr preferentially segregates into the dendrite cores and promotes the formation of the BCC phase, while Cu, Ni, Fe, and Al are enriched in the interdendritic regions and stabilize the FCC phase. Thus, the BCC/FCC phase constitution can be tailored by composition design, which provides a microstructural basis for balancing strength and ductility in the (CuNiMn)-X alloy system.
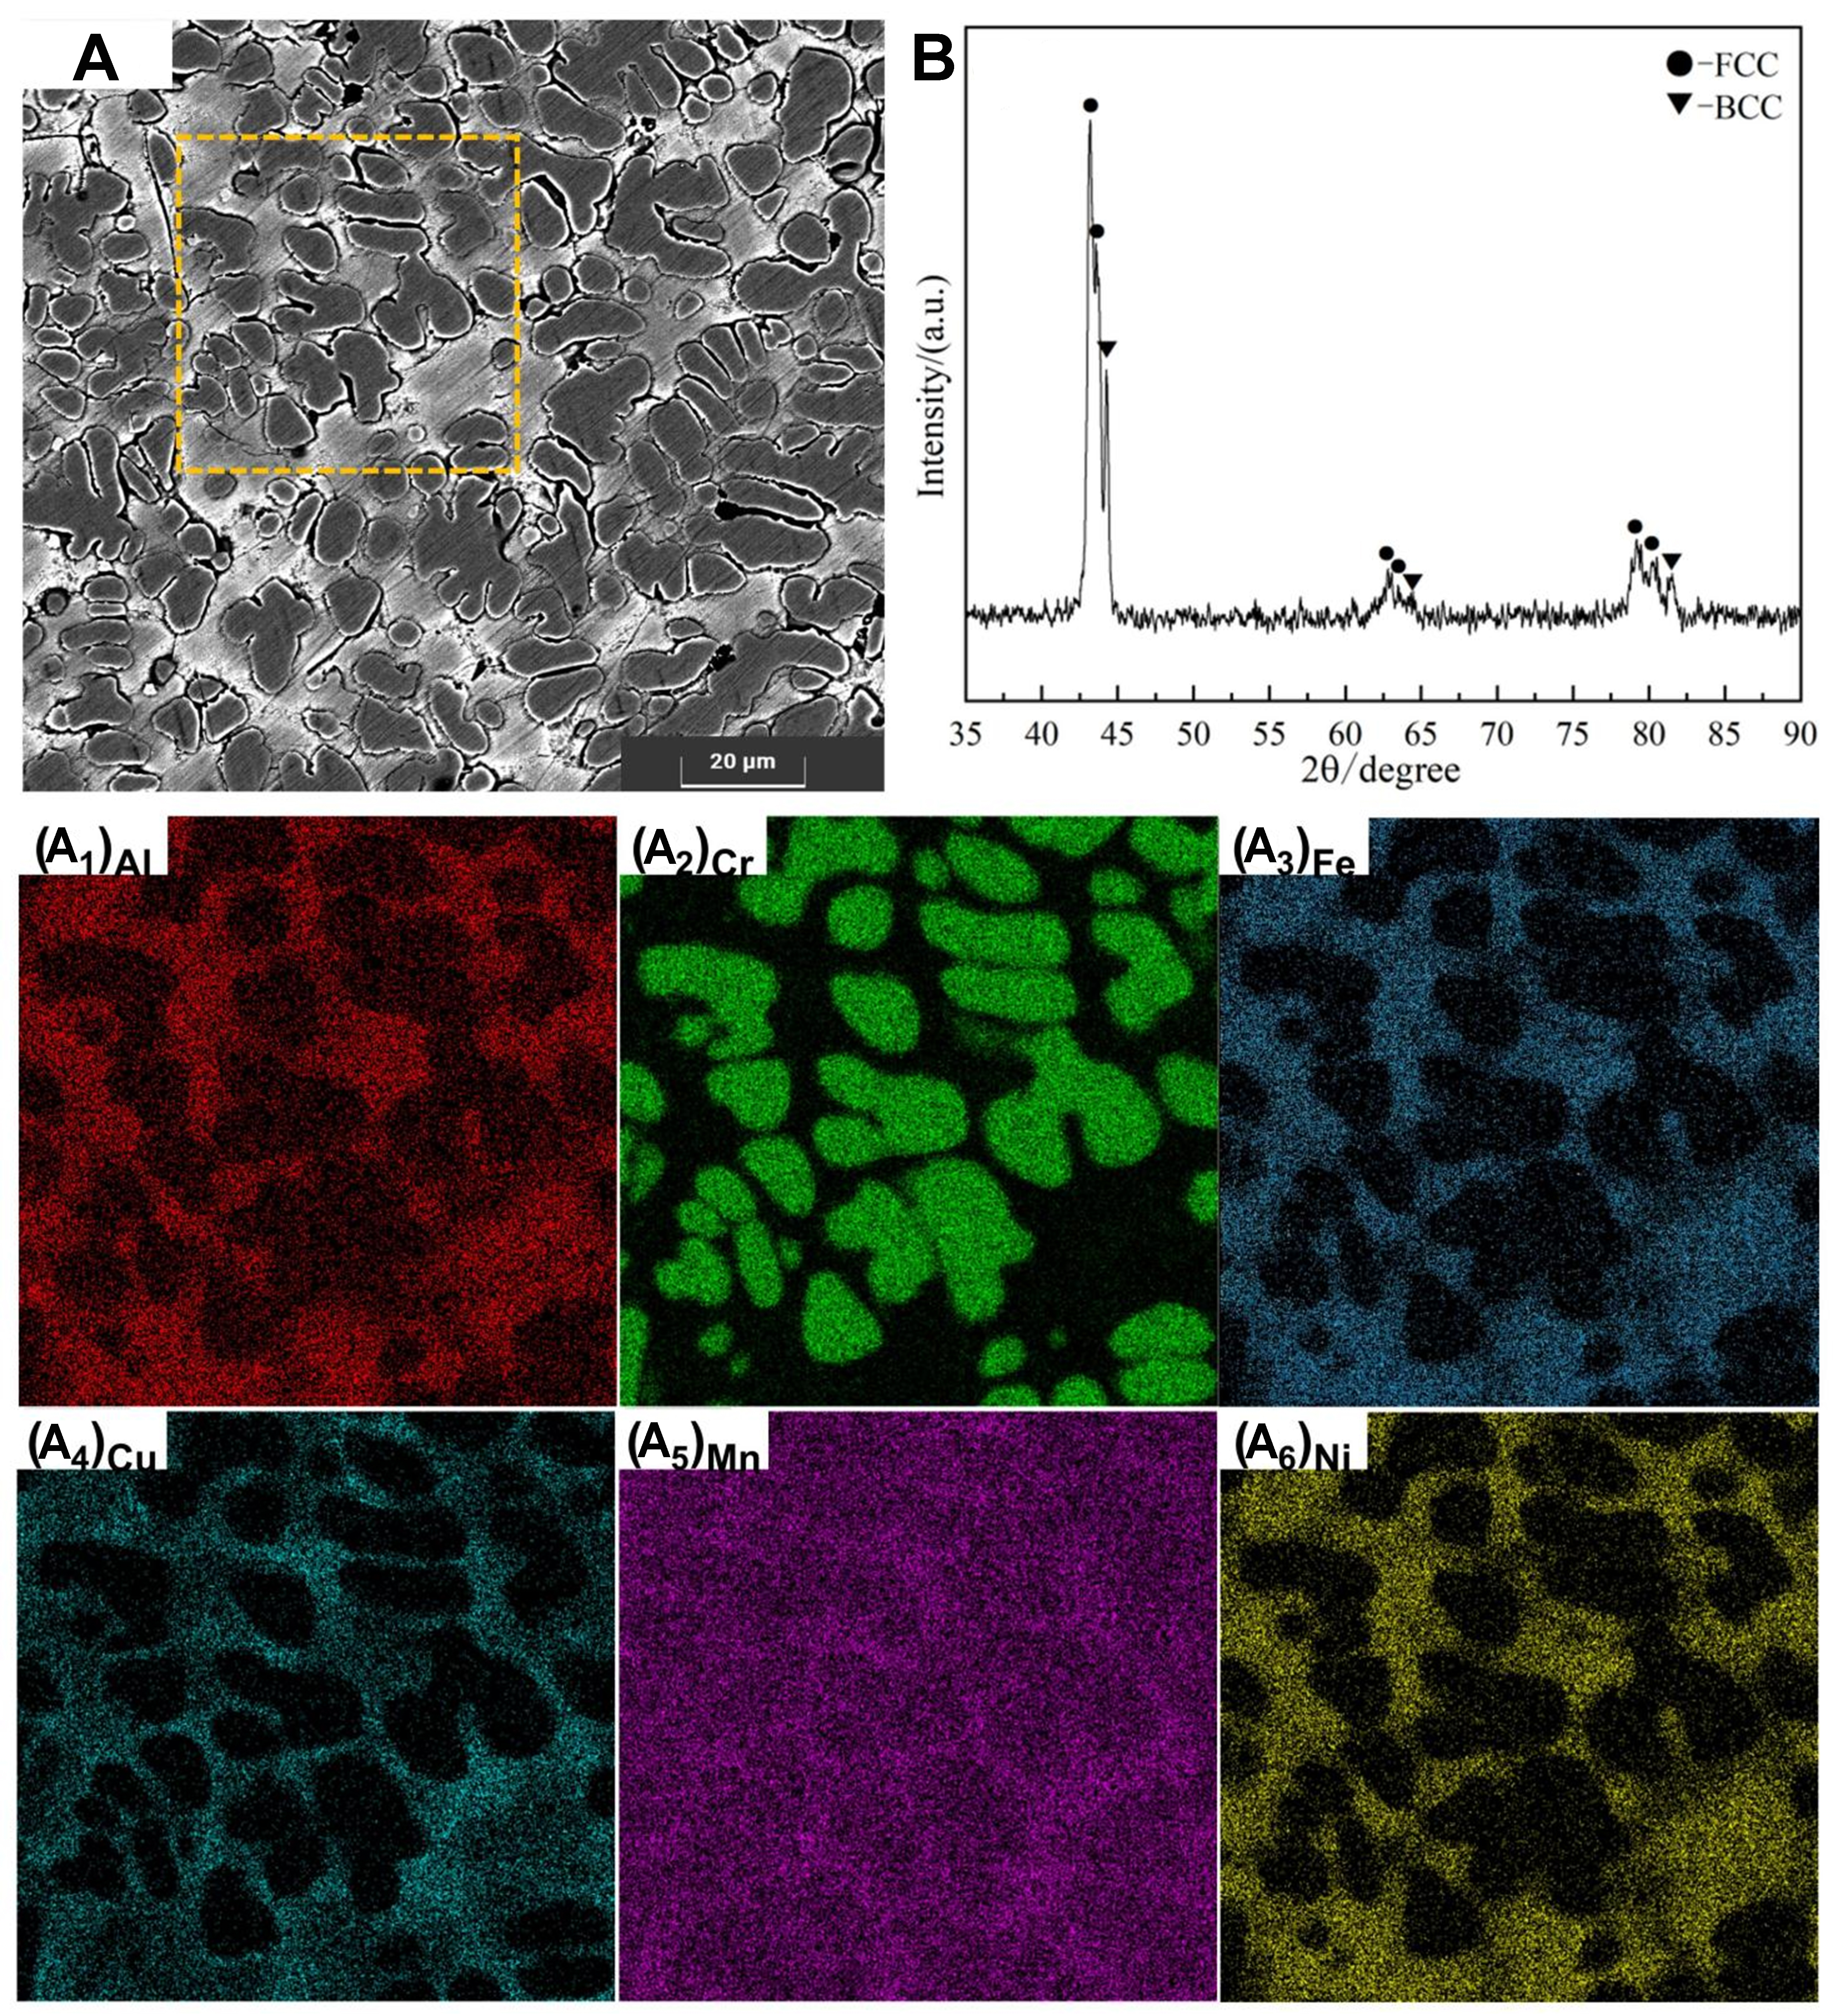
Figure 5. The microstructure morphology of the (CuNiMn)-Al16Cr16Fe16 alloy. (A) SEM image; (B) XRD analysis, and (A1-A6) energy spectrum analysis. SEM: Scanning electron microscopy; XRD: X-ray diffraction; FCC: face-centered cubic; BCC: body-centered cubic.
Relationship between key feature factors and target
To elucidate the intrinsic physical mapping between alloy features and phase types, SHAP interpretability analysis was applied to the phase classification model, with the results presented in Figure 6. Since the phase output is categorical, including BCC, BCC+FCC, and FCC, the SHAP analysis was performed on the predicted probability of each phase class rather than on the discrete phase label. Specifically, class-specific SHAP values were calculated in a one-vs-rest manner. A positive SHAP value for a given phase class indicates that the corresponding feature increases the predicted probability of that class relative to the baseline probability, whereas a negative SHAP value indicates a decrease in that class probability. From the feature importance ranking shown in Figure 6A, the mean valence electron number (M-E10) is identified as the primary factor governing phase classification, with its mean absolute SHAP value significantly higher than those of the other features. According to the Hume-Rothery rules and electron theory[38], in multi-component alloys, the FCC phase is stable when the VEC exceeds 8.0, the BCC phase is stable when VEC is below 6.87, and the dual-phase region lies in between. The physical origin of this behavior lies in the interaction between the Fermi surface and the Brillouin zone boundaries: when the VEC reaches 8.0, the Fermi surface becomes tangent to the (111) Brillouin zone boundary of the FCC structure, resulting in the most stable electronic configuration[39]. Additionally, the mean absolute electronegativity (M-E4) and mean enthalpy of vaporization (M-C4) rank second and third in importance, respectively. Electronegativity reflects the ability of an atom to attract electrons; a larger electronegativity difference promotes more pronounced charge transfer between atoms and increases the ionic character of bonds, favoring the formation of structures with stronger directionality and higher coordination numbers[19,22]. The enthalpy of vaporization characterizes the strength of interatomic bonding; a higher enthalpy of vaporization indicates stronger interatomic interactions, which favor the formation of more densely packed crystal structures[40]. As the most densely packed structure (with an atomic packing factor of 0.74), the FCC phase requires stronger interatomic bonding, whereas the BCC phase, being less densely packed (with an atomic packing factor of 0.68), has a relatively lower requirement for bond strength[41]. Consequently, combinations of elements with high enthalpies of vaporization tend to stabilize the FCC phase. In contrast, the mixing entropy (S), the variance of van der Waals radii (V-A8), and the partial variance of Young’s modulus (P-C6) make comparatively weaker contributions, with their mean absolute SHAP values being 42%, 38%, and 31% of that of M-E10, respectively. This ranking reveals that the phase structure evolution is governed predominantly by electronic structure (VEC and electronegativity) and interatomic bonding energy, rather than by atomic size mismatch or configurational entropy.
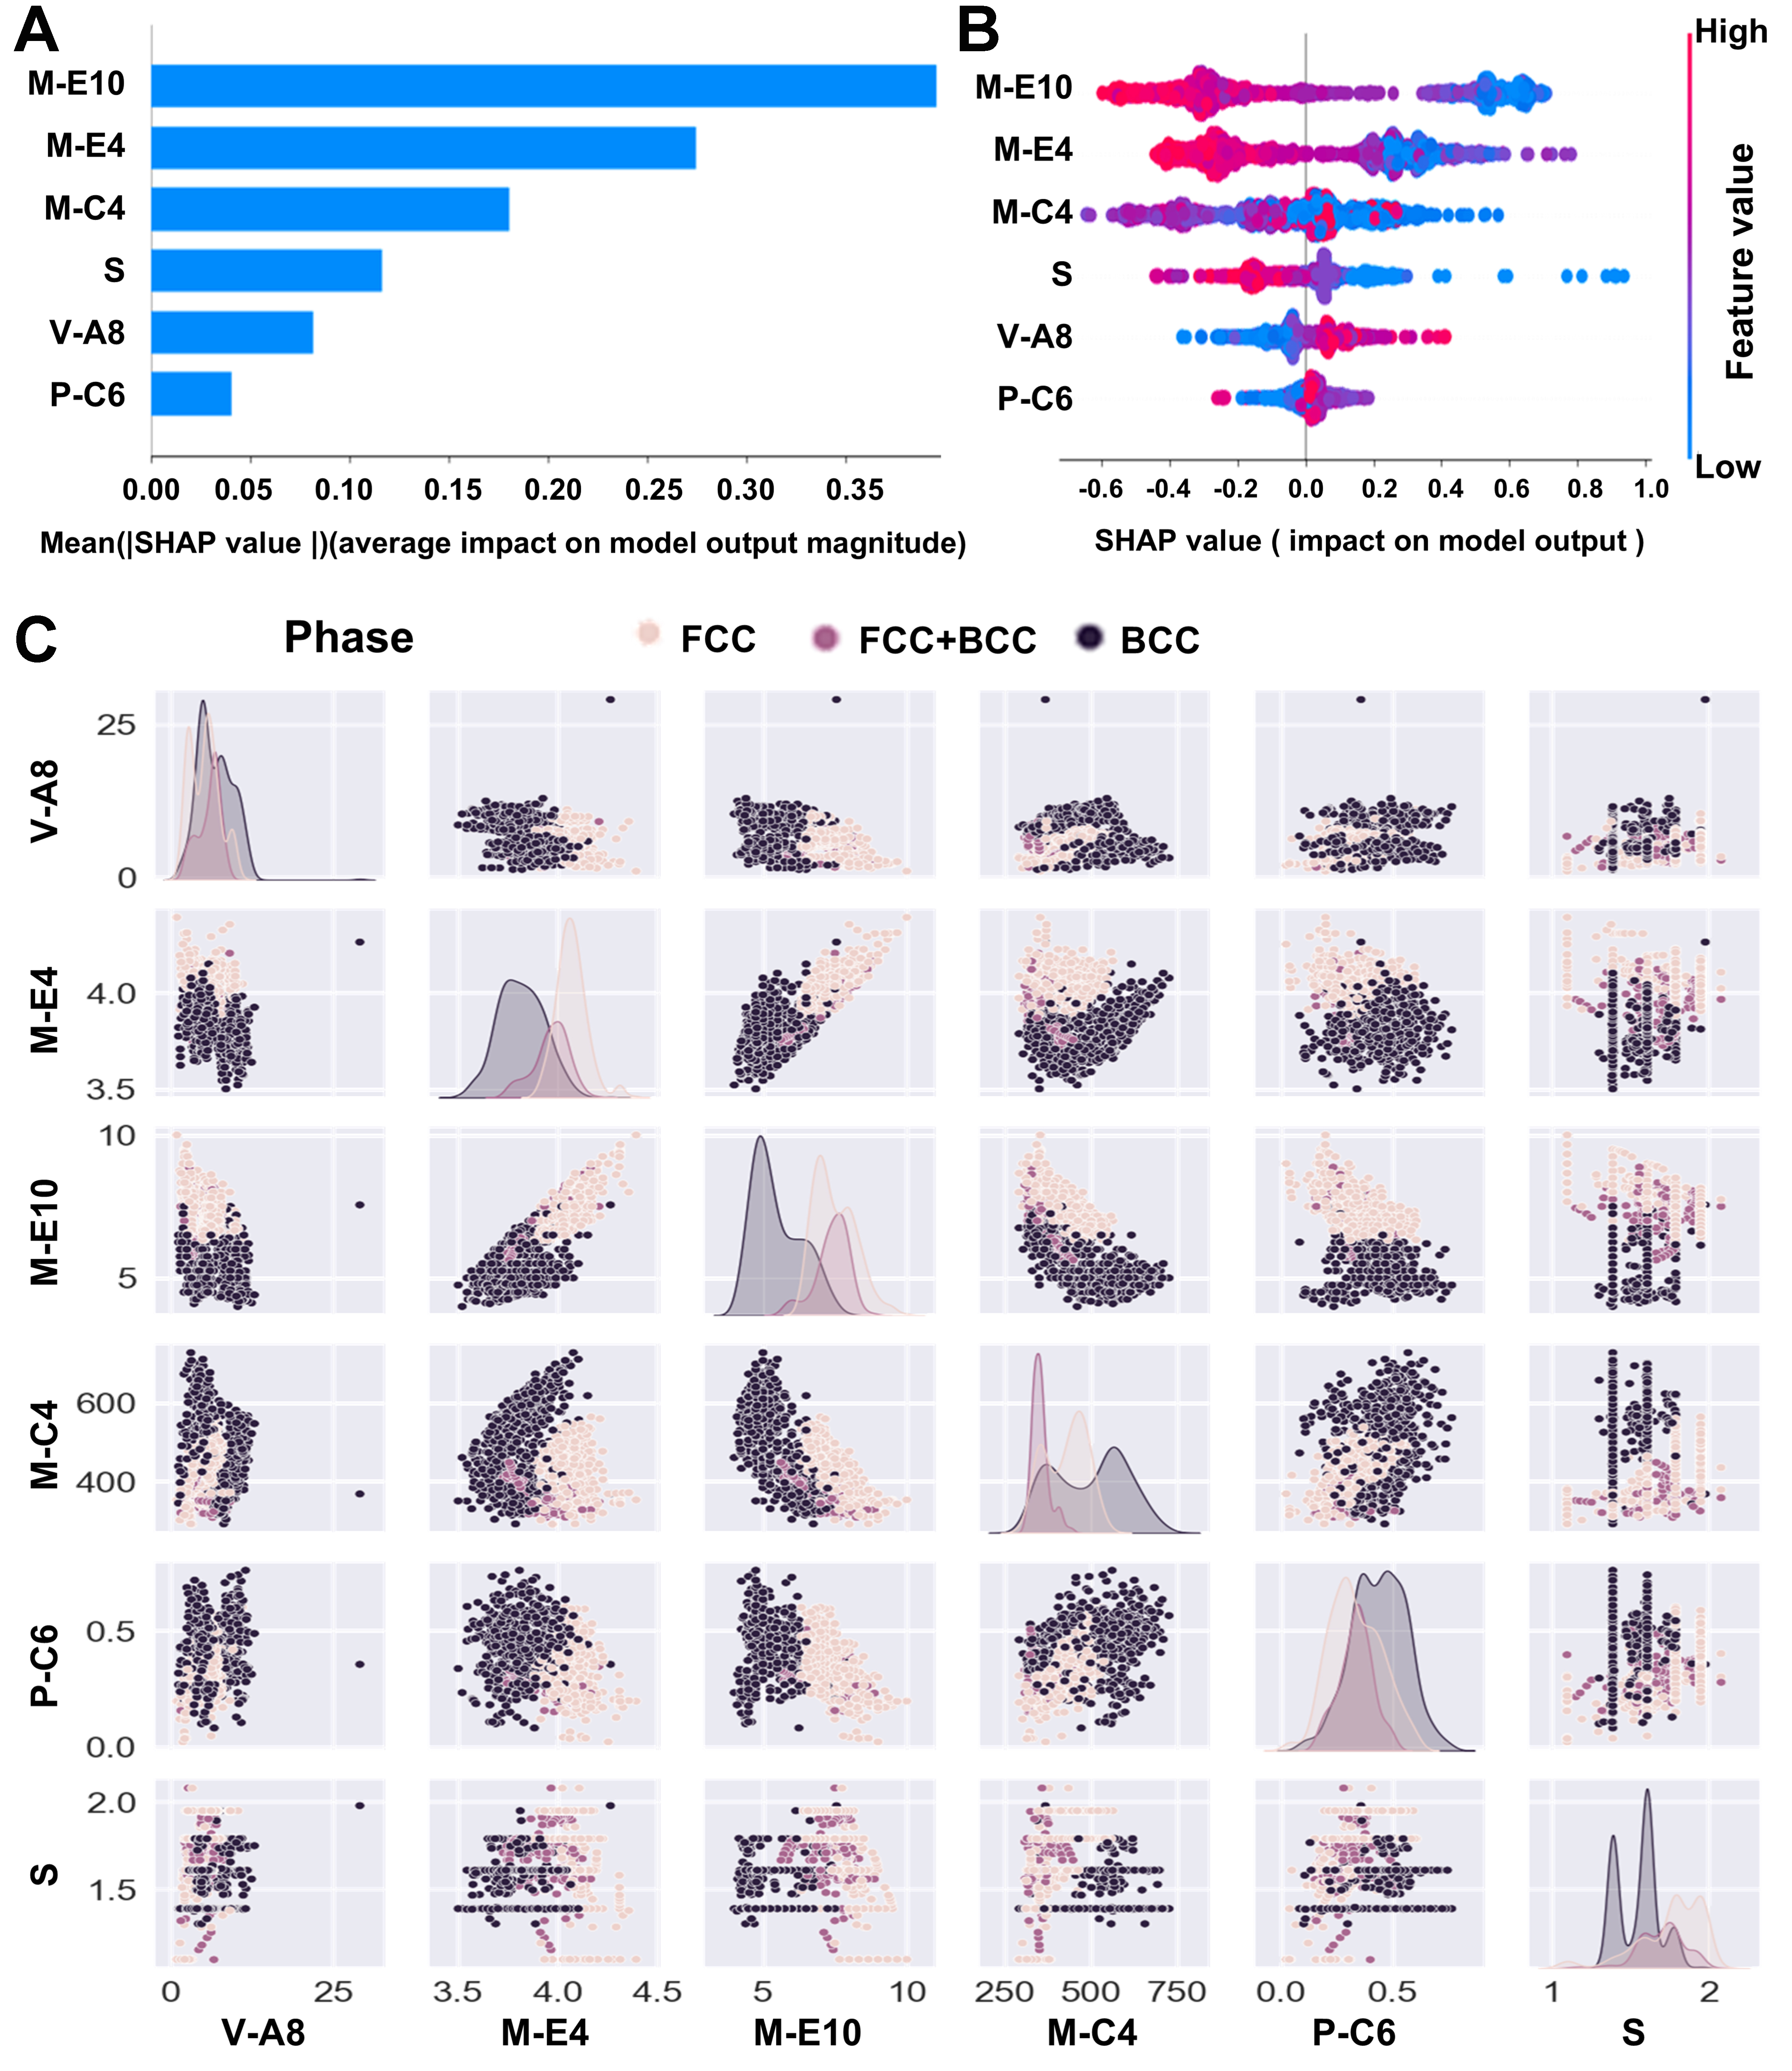
Figure 6. Relationship between phase type and feature factors. The phase model was treated as a multi-class classification model with three classes: BCC, BCC+FCC, and FCC. SHAP values were calculated based on the predicted class probabilities in a one-vs-rest manner. A positive SHAP value indicates an increase in the predicted probability of the corresponding phase class relative to the baseline probability, whereas a negative SHAP value indicates a decrease. (A) Class-specific SHAP feature importance; (B) SHAP summary plot for the phase probability output; and (C) Feature distribution of different phase categories. BCC: Body-centered cubic; FCC: face-centered cubic; SHAP: SHapley Additive exPlanations.
Figure 6B reveals the driving direction of each feature value on the model prediction. For M-E10, the class-specific SHAP values show opposite effects for different phase classes. High M-E10 values increase the predicted probability of the FCC class and decrease the probability of the BCC class, whereas low M-E10 values increase the predicted probability of the BCC class and decrease the probability of the FCC class. Intermediate M-E10 values contribute more strongly to the BCC+FCC class probability, indicating a transitional composition region where the two phases coexist. This trend is consistent with the VEC criterion: FCC phases are favored when VEC exceeds 8.0, BCC phases are favored when VEC is below 6.87, and the dual-phase region lies between these two limits. When the VEC is low, the Fermi level lies in the d-band region, where the BCC structure is energetically favored; as the VEC increases, the Fermi level shifts upward into the s-p band region, where the FCC structure becomes energetically favorable, triggering the BCC → FCC transition[39]. Additionally, both M-E4 and M-C4 exhibit monotonic driving characteristics: high values drive predictions toward the FCC phase, while low values drive predictions toward the BCC phase.
The joint distribution matrix of multi-dimensional features [Figure 6C] visually illustrates the physical clustering behavior of the alloy phases in a low-dimensional feature space. From the kernel density estimation (KDE) plots along the diagonal, it can be seen that M-E10 exhibits the best discriminative capability among the three phase types: the BCC phase (dark purple) is concentrated in the low M-E10 region, the FCC phase (light pink) in the high M-E10 region, and the FCC+BCC dual phase (purple-red) occupies the transitional zone between them. This distribution indicates that as the VEC increases, the predicted phase probability gradually shifts from the BCC class to the BCC+FCC class and finally to the FCC class. Notably, the KDE distributions of other diagonal features (e.g., M-E4, M-C4) differ from that of M-E10. For M-E4, the KDE curves of the three phase types exhibit a pronounced unimodal distribution: with increasing M-E4, the microstructure transforms from single BCC to FCC+BCC dual phase and then to single FCC, suggesting a monotonic threshold effect - below a certain critical value, lower electronegativity tends to stabilize the BCC structure, whereas above this critical value, higher electronegativity promotes the formation of the FCC structure. Examination of the off-diagonal two-dimensional scatter plots (e.g., M-E10 vs. M-E4, or M-E10 vs. M-C4) reveals that different phase categories form distinct phase boundaries in these two-dimensional feature spaces. In the scatter plot of M-E10 vs. M-E4, the BCC phase is concentrated in the quadrant with low M-E10 and low M-E4, the FCC phase is concentrated in the quadrant with high M-E10 and high M-E4, while the FCC+BCC dual phase is distributed along the diagonal, forming a transitional zone connecting the two single-phase regions. This demonstrates that the combination of electronic structure and interatomic bonding energy features can effectively differentiate among different phase types.
This result further indicates that the BCC/FCC phase constitution in the (CuNiMn)-X alloy system can be controlled by composition-induced tuning of the VEC. Specifically, increasing the proportion of FCC-stabilizing elements with relatively high VEC promotes the formation of the FCC phase, whereas increasing the fraction of BCC-stabilizing elements or reducing the average VEC favors the BCC phase. When the VEC falls within the transitional range, the alloy tends to form a BCC+FCC dual-phase microstructure. Therefore, the type and content of alloying elements, especially Al, Ti, Cr, and Fe, can be adjusted to regulate the VEC, electronegativity, atomic-size mismatch, and thermodynamic interactions, thereby controlling phase formation and elemental partitioning in the (CuNiMn)-X alloys.
Figure 7 presents the relationship between the alloy feature factors and the compressive strength. From the global SHAP feature importance plot [Figure 7A], it can be seen that the mean atomic radius (M-A4) is the dominant factor determining the compressive strength, with its mean absolute SHAP value significantly higher than those of the other features. The variance of van der Waals radii (V-A8) and the variance of covalent radii (V-A6) rank second and third, respectively. This ranking is in strong agreement with classical solid-solution strengthening theory, where differences in atomic radius induce lattice distortion, generate elastic stress fields, and impede dislocation motion[42]. Additionally, the mean absolute electronegativity (M-E4) and the thermodynamic parameter Ω also rank among the top contributors. This is because high electronegativity enhances interatomic bonding and shifts the metallic bond toward a more covalent character[36,43], while a high Ω value reflects a thermodynamic tendency to form stable solid solutions, which helps suppress the precipitation of brittle phases[43,44]. In contrast, features such as mixing entropy (S) and the partial variance of Young’s modulus (P-C6) make comparatively weaker contributions.
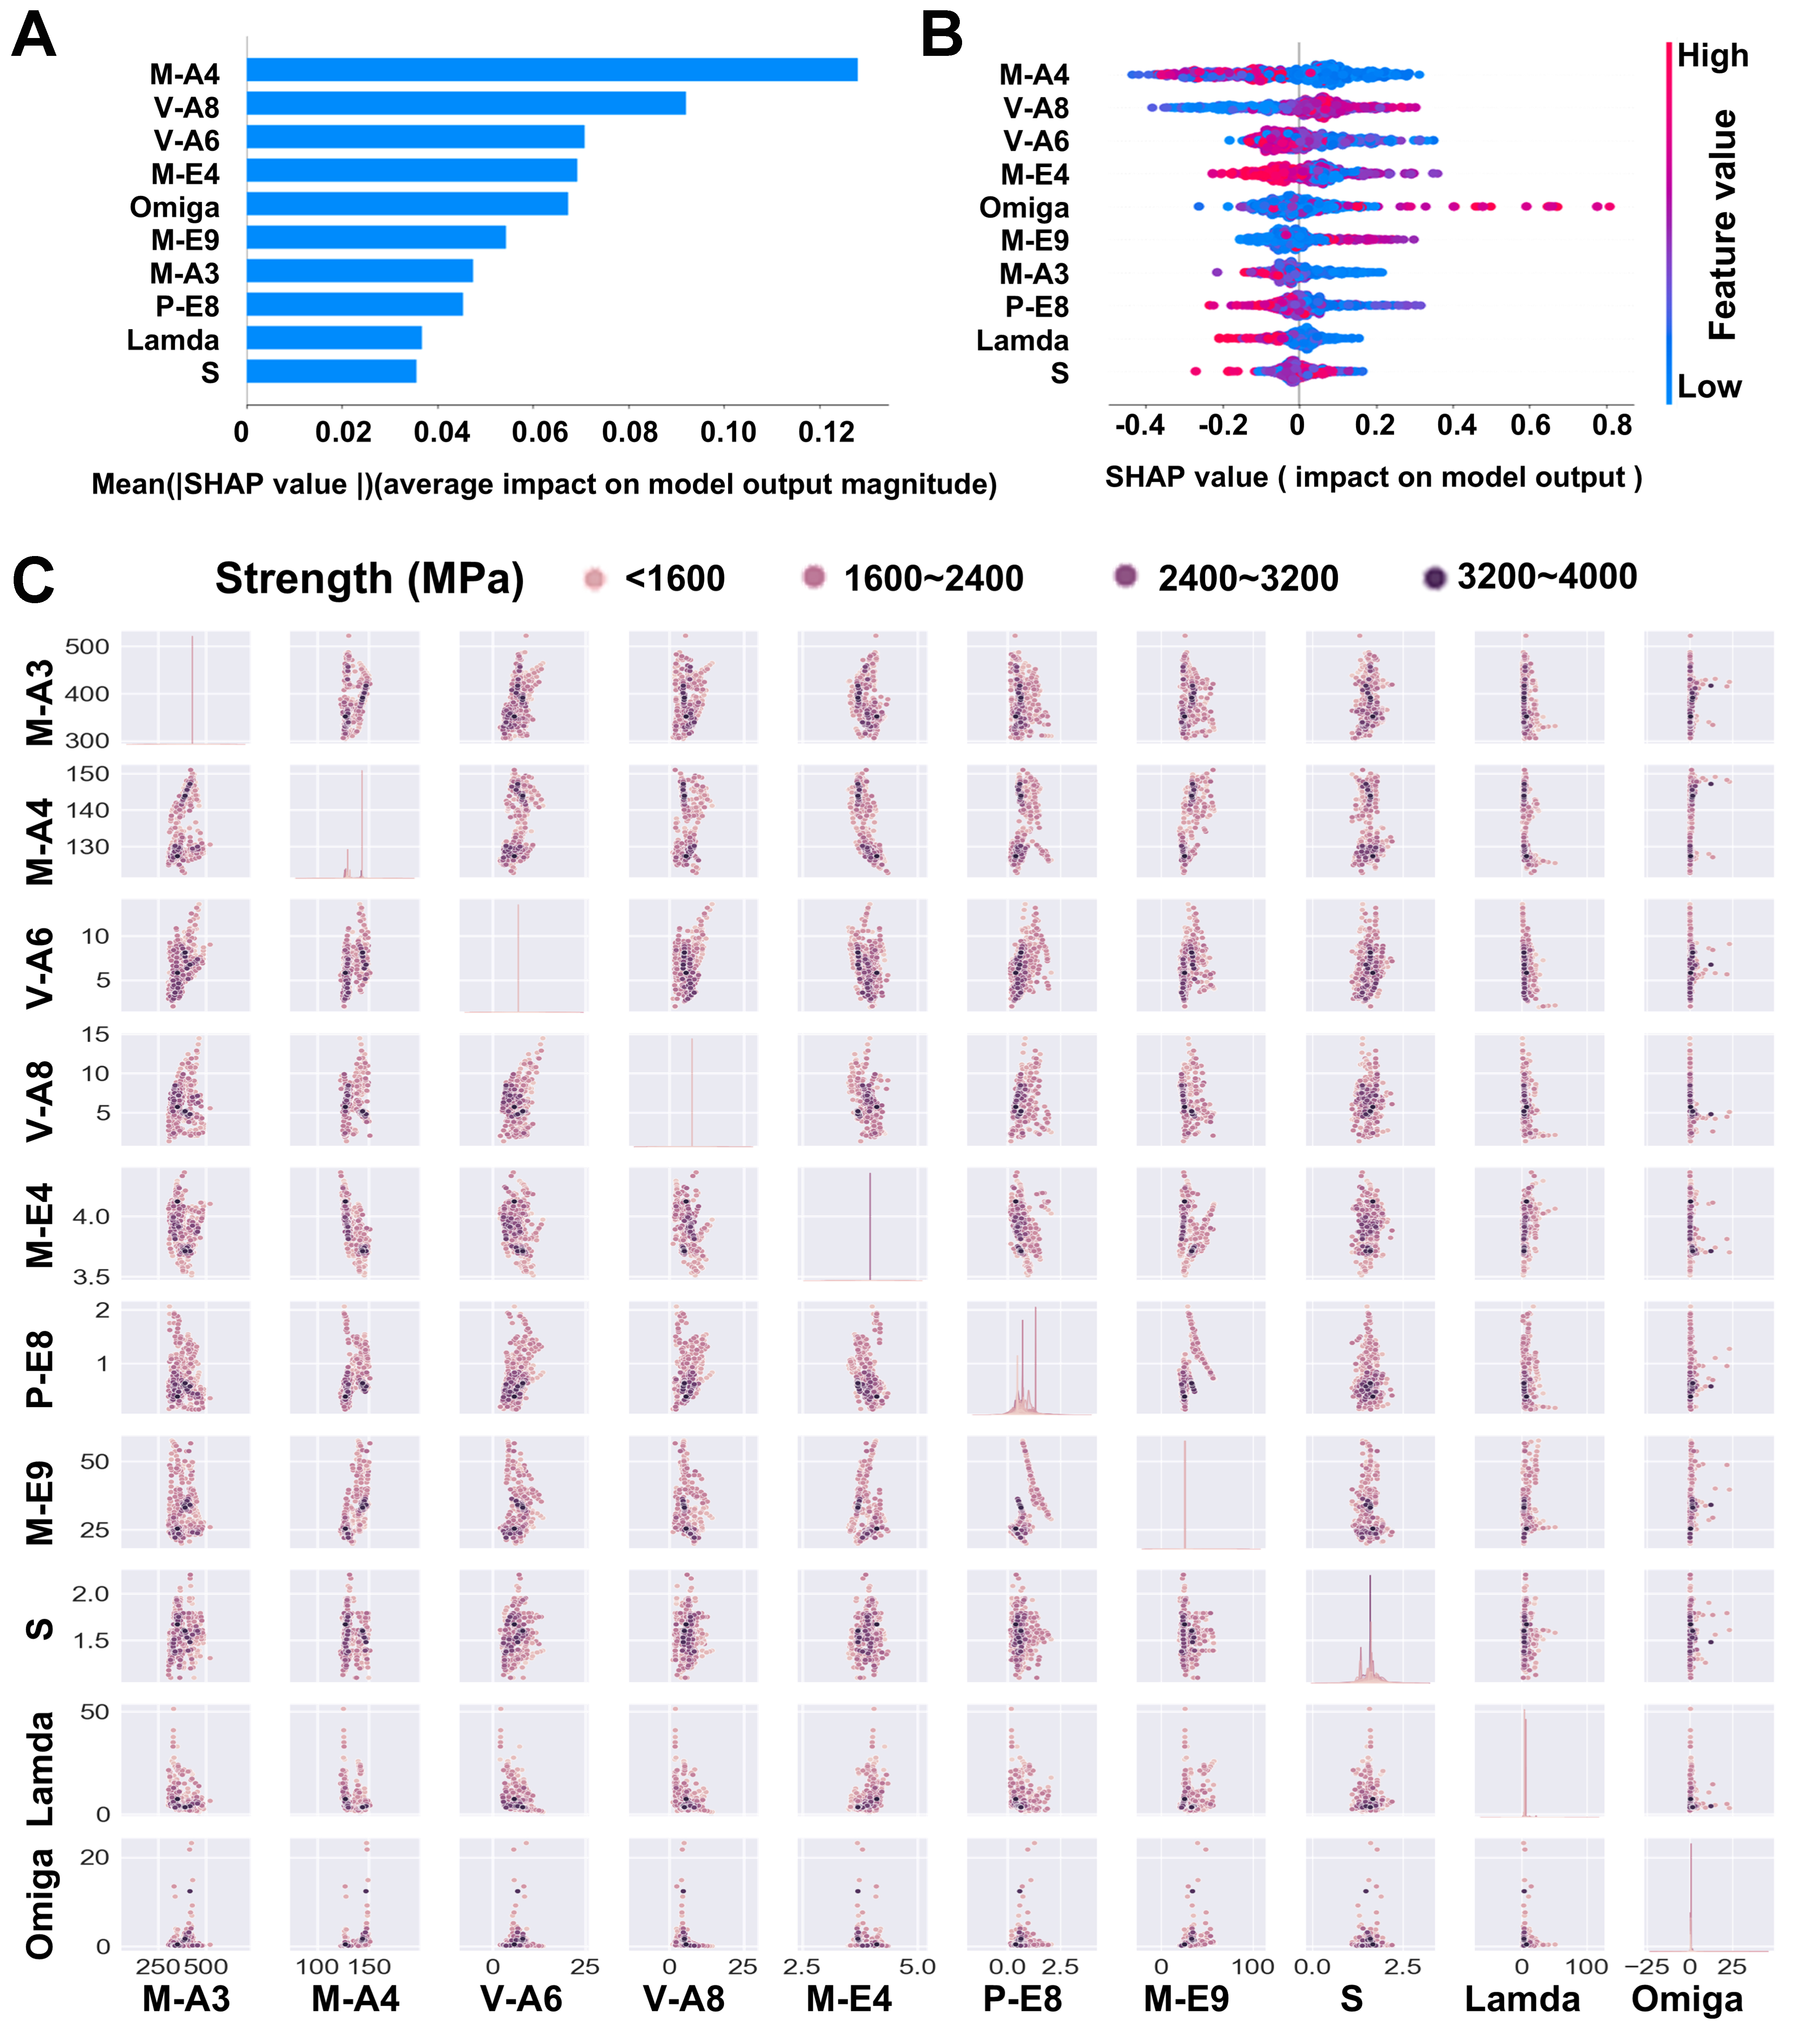
Figure 7. The relationship between compressive strength and feature factors: (A) assessment chart of importance; (B) SHAP influence diagram; and (C) scatter distribution diagram. SHAP: SHapley Additive exPlanations.
From the distribution trends in the SHAP local interaction plot [Figure 7B], it can be clearly observed that a smaller mean atomic radius (blue low values of M-A4) together with larger variances of atomic radii (red high values of V-A8 and V-A6) yield positive SHAP values, thereby substantially enhancing the compressive strength of the alloy. From a physical metallurgy perspective, a high degree of atomic radius disparity (high variance) increases the topological disorder, leading to severe lattice distortion, which significantly increases the resistance to dislocation motion[45,46]. Meanwhile, a smaller mean atomic radius may indicate the incorporation of a higher fraction of transition elements with stronger bonding strength or smaller atomic volumes, further raising the lattice friction stress of the matrix[47]. In addition, electronic structure and thermodynamic stability play a synergistic and non-negligible role in the design of high-strength alloys; higher values of M-E4 and Ω (red dots) generally correspond to enhanced strength. A high mean electronegativity typically implies reduced interatomic spacing and increased electron cloud overlap, shifting the metallic bond toward a stronger covalent character, thereby elevating the intrinsic yield strength[48]. A high Ω value, on the other hand, reflects a strong thermodynamic tendency to form stable multi-component solid solutions, which helps suppress the precipitation of brittle intermetallic compounds and ensures matrix continuity and favorable strength–toughness synergy under high compressive stress[44].
The multi-dimensional feature scatter matrix [Figure 7C] reveals that alloys with different strength levels exhibit distinct physical separation in the feature space. Ultrahigh-strength alloys with compressive strength exceeding 3,200 MPa (dark purple) form highly concentrated clusters in two-dimensional projection planes such as “low M-A4 with high V-A6” and “high M-E4 with high Ω”. This arises because, on one hand, a smaller mean atomic radius (M-A4) indicates the presence of a larger proportion of elements with smaller atomic volumes; the size mismatch between these elements and the Cu–Ni matrix generates localized elastic strain fields that impede dislocation motion[30]. On the other hand, a larger variance in atomic radii (V-A6) reflects substantial size differences among the constituent elements, which intensify lattice distortion. According to the Labusch solid-solution strengthening model[45,49], the strengthening effect is proportional to the 4/3 power of the atomic size misfit. Therefore, the combination of a “small-atom matrix and large size disparity” is conducive to enhancing the strength of the alloy.
Figure 8 presents the relationship between the alloy feature factors and the fracture strain. The feature importance ranking [Figure 8A] shows that the variance of the enthalpy of fusion (V-C3) is the dominant feature governing the fracture strain, with its mean absolute SHAP value significantly higher than those of the other features. The mixing entropy (S), the variance of covalent radius (V-A6), and the partial variance of shear modulus (P-C8) rank second, third, and fourth, respectively. In contrast, features that determine strength, such as the mean atomic radius (M-A4) and mean electronegativity (M-E4), contribute much less in this context.
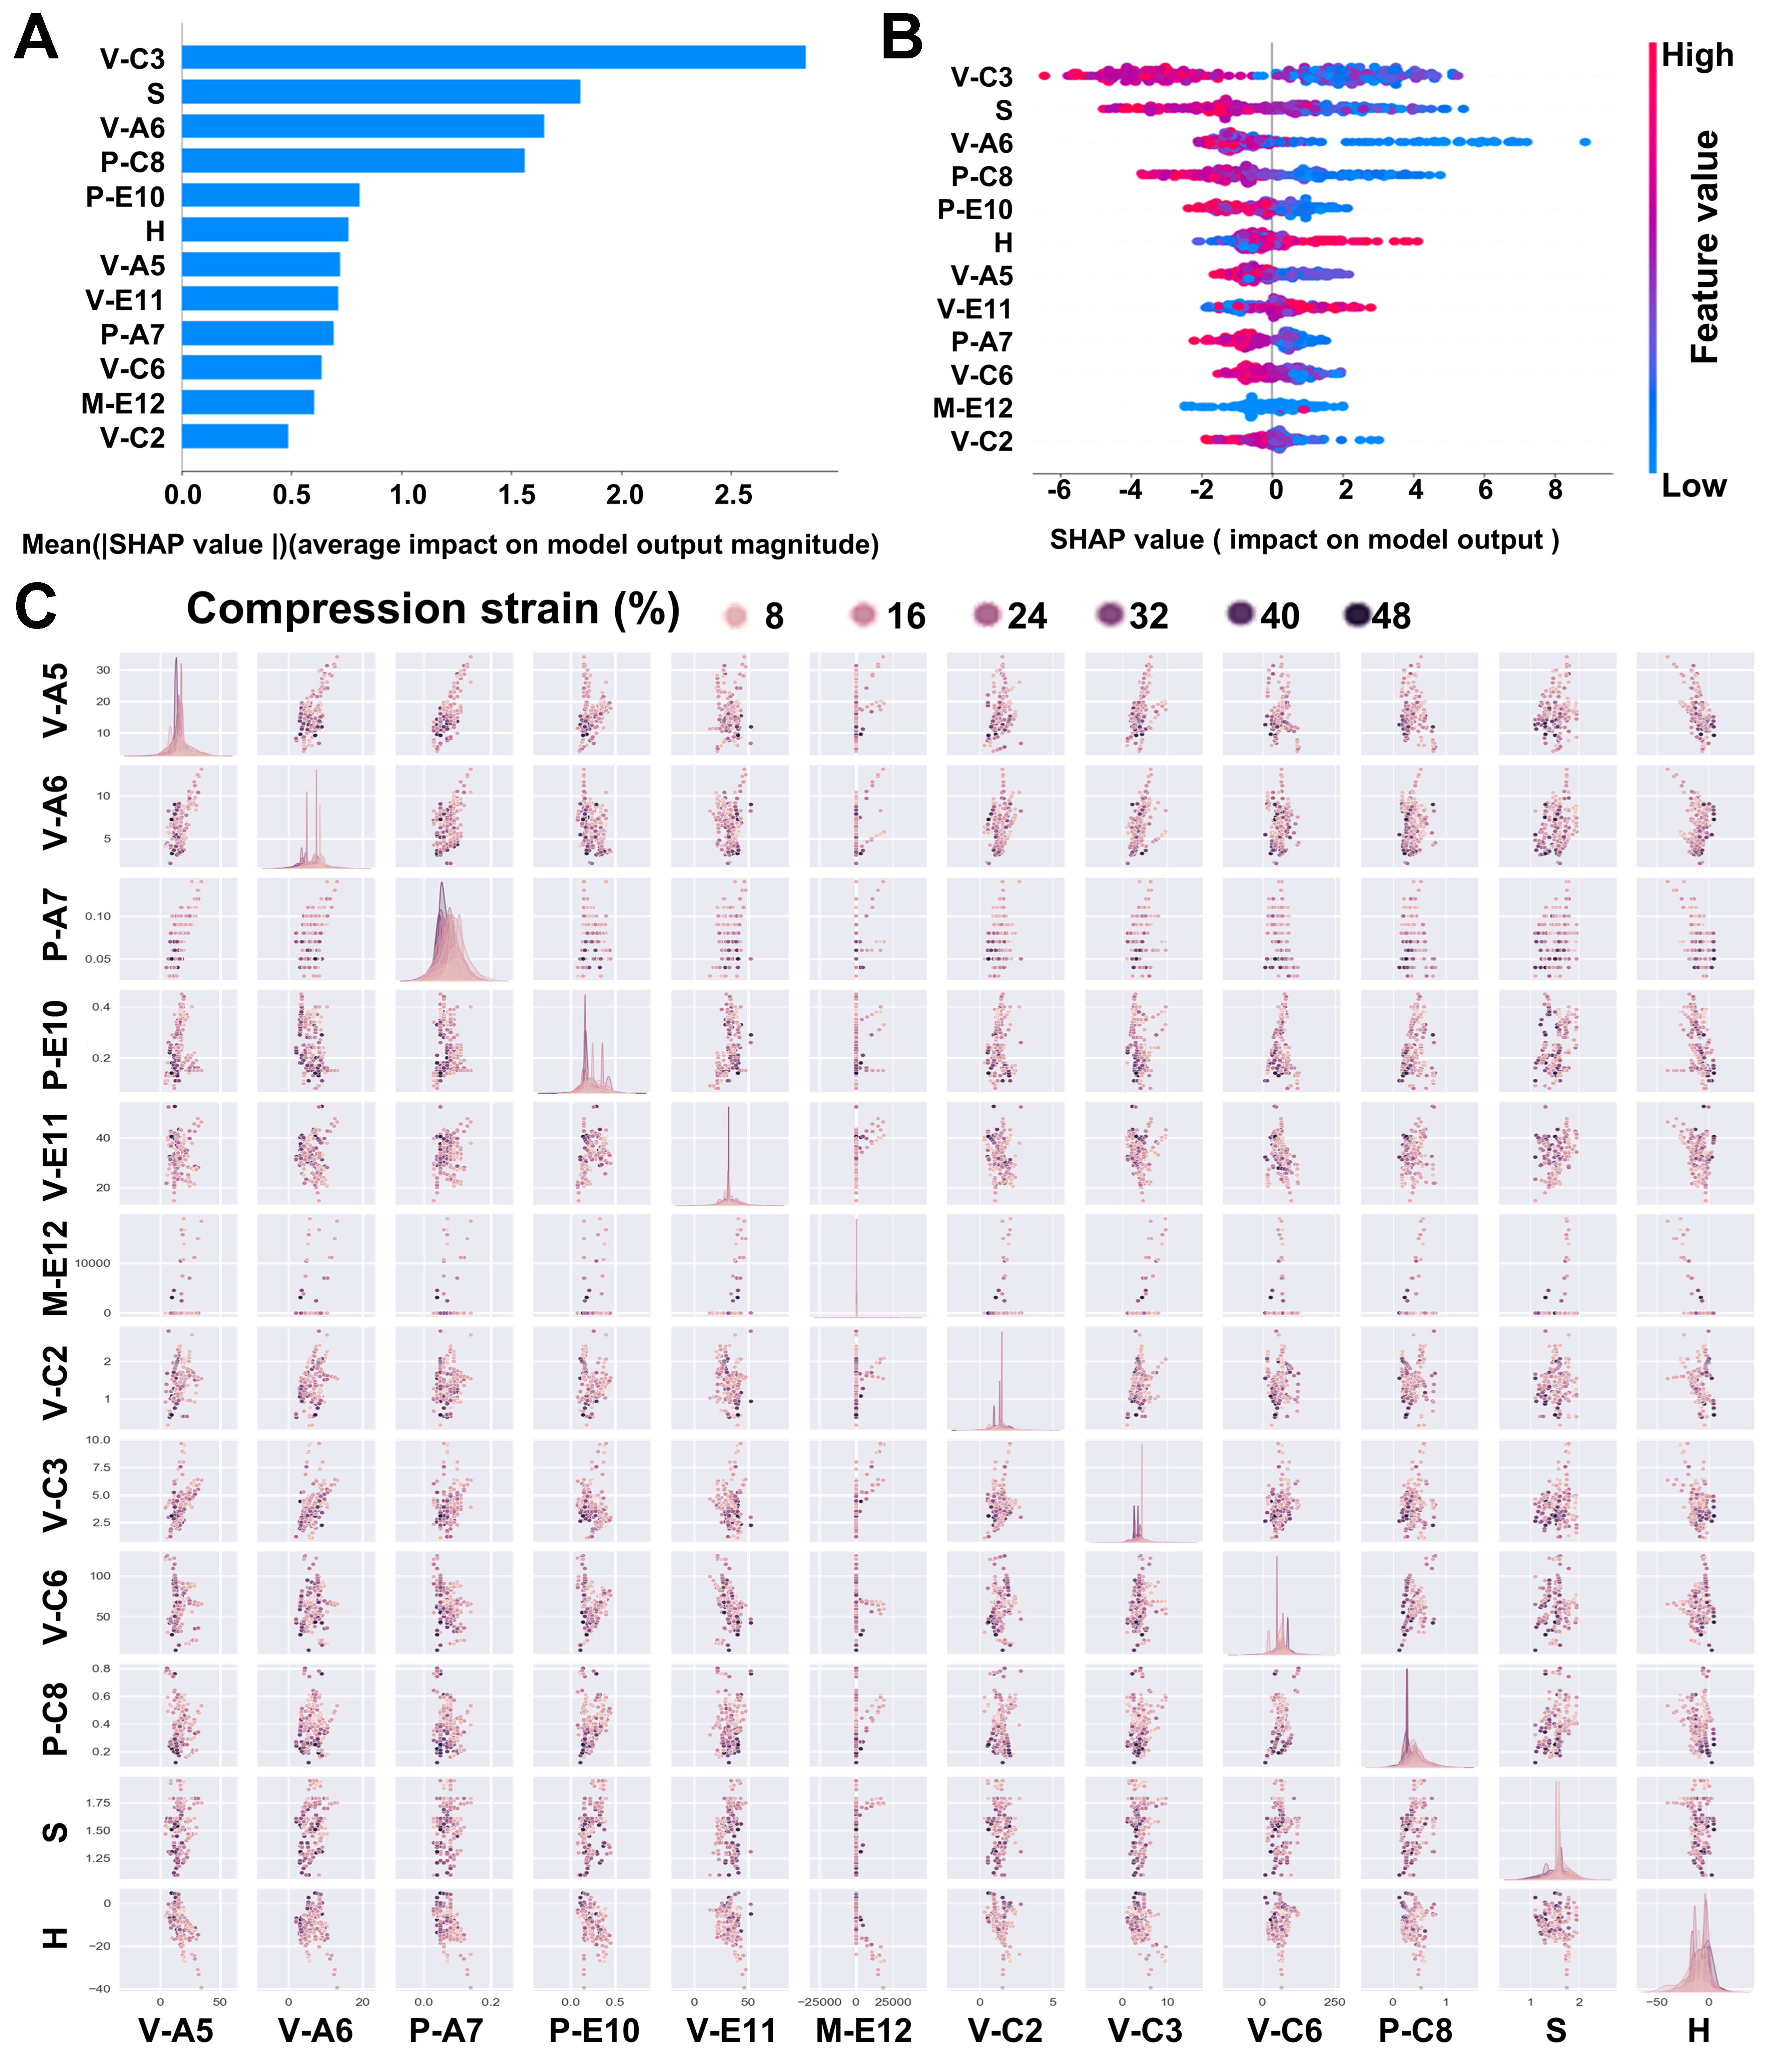
Figure 8. The relationship between compression strain and feature factors: (A) assessment chart of importance; (B) SHAP influence diagram; and (C) scatter distribution diagram. SHAP: SHapley Additive exPlanations.
From the distribution trends in the SHAP local interaction plot [Figure 8B], it can be clearly observed that for V-C3, low feature values (blue) correspond to positive SHAP values, indicating that a more uniform distribution of fusion enthalpy leads to a higher fracture strain. From a physical metallurgy perspective, the fusion enthalpy reflects the strength of interatomic bonding; a lower variance in fusion enthalpy implies that the bond strengths among the constituent elements in the alloy are relatively uniform, effectively avoiding the formation of brittle microdomains caused by localized clustering of strong covalent or ionic bonds. Such uniformity in chemical bonding facilitates the homogeneous transfer of stress through the lattice and delays local stress concentration and microcrack nucleation[50]. The SHAP distribution of mixing entropy (S) also exhibits a trend where low values drive high ductility. Excessively high configurational entropy often accompanies forced solid solution of complex multi-components, which can readily induce the precipitation of brittle intermetallic compounds or topologically close-packed phases, fragmenting the matrix and leading to a sharp loss in ductility[51,52]. Therefore, a low-entropy state is more favorable for maintaining matrix continuity and plastic deformability. For V-A6 and P-C8, similarly, low values drive high ductility. A smaller variance in covalent radius indicates a reduced atomic size mismatch, resulting in lower lattice distortion energy in the matrix and a significantly reduced Peierls stress for dislocation slip[53]. A smaller partial variance in shear modulus reflects a uniform distribution of elastic modulus at the microscale, avoiding dislocation pile-ups caused by alternating soft and hard regions, thereby enabling the alloy to undergo extensive homogeneous plastic deformation[54].
The multi-dimensional feature scatter matrix [Figure 8C] shows that on the two-dimensional projection plane of “variance of fusion enthalpy (V-C3) vs. variance of covalent radius (V-A6)”, alloys with high fracture strain (> 40%, dark purple) are highly concentrated in the quadrant with low V-C3 and low V-A6, forming a dense cluster, whereas alloys with low fracture strain (< 20%, light yellow) are scattered in regions with high variances. This indicates that “dual homogenization in thermodynamics and structure” is beneficial for enhancing ductility; when both the chemical bond strength and the atomic size distribution become uniform, the resistance to dislocation motion is minimized, resulting in optimal plastic deformability[51]. Furthermore, on the two-dimensional projection plane of “variance of fusion enthalpy (V-C3) vs. partial variance of shear modulus (P-C8)”, ultrahigh-ductility alloys also exhibit a distribution pattern converging strongly toward the origin of the coordinate axes (low V-C3, low P-C8). This suggests that uniformity in elastic properties is equally indispensable - a homogeneous distribution of shear modulus avoids local stress concentrations and dislocation pile-ups, allowing plastic deformation to proceed continuously[52]. Notably, the clustering positions of high-ductility alloys exhibit a distinct symmetry in feature space with respect to those of the ultrahigh-strength alloys (low M-A4, high V-A6, high M-E4) described previously. This indicates that high strength requires large atomic size disparity and high electronegativity to enhance lattice distortion and bond strength, whereas high ductility requires a high degree of uniformity in size, bonding, and modulus to reduce resistance to dislocation motion.
CONCLUSION
(1) This work establishes a closed-loop machine learning design strategy integrating feature engineering, autonomous model optimization, and interpretability analysis. A total of 79 feature factors are constructed from five dimensions, including atomic, electronic, energetic, physical, and chemical, and the optimal feature subsets for microstructure, compressive strength, and fracture strain (6, 10, and 12 features, respectively) are obtained through Pearson correlation and recursive feature elimination. Using SVR combined with grid-based hyperparameter optimization and 100 random data splits, autonomous model screening is achieved. The selected optimal models yield prediction accuracies of 92.6%, 89.2%, and 88.1% for the microstructure, compressive strength, and fracture strain models, respectively. In addition, the mean accuracy and standard deviation over 100 independent random splits confirm the stability and robustness of the models, while experimental validation errors of -5.0% and -3.2% further demonstrate the effectiveness of the proposed strategy.
(2) The physical mechanisms governing the relationships between feature attributes and properties are elucidated. Probability-based SHAP analysis of the multi-class phase model reveals that the VEC (M-E10) serves as the core descriptor determining the predicted probabilities of BCC, BCC+FCC, and FCC phases, in excellent agreement with the VEC criterion. The mean atomic radius (M-A4) together with the variances of atomic radii (V-A6, V-A8) dominates the compressive strength, manifesting the lattice distortion strengthening mechanism. The variances of fusion enthalpy (V-C3), covalent radius (V-A6), and shear modulus (P-C8) collectively control the fracture strain, highlighting the critical role of “triple homogeneity” in thermodynamics, structure, and elasticity for achieving superior ductility.
(3) The (CuNiMn)Al16Cr16Fe16 alloy is successfully developed. This alloy exhibits a compressive strength of 2,542 MPa and a fracture strain of 15.8%, in excellent agreement with the predicted values. Microstructural characterization reveals a “hard and tough” dual-phase composite structure consisting of Cr-rich BCC dendrite arms and a Cu-Ni-Fe-Al-rich FCC interdendritic network. The thermodynamically driven spontaneous elemental partitioning behavior provides the microstructural basis for the strength–ductility synergy. The closed-loop design strategy established in this study offers a new paradigm for the efficient and precise design of CuNiMn-based multi-principal element copper alloys and may be extended to other complex multi-principal element alloy systems.
DECLARATIONS
Authors’ contributions
Conception and design of the review: Tan, F.; Chen, W.; Zhao, Z.; Jiang, Y.
Software and model support: Tan, F.; Chen, W.; Zhao, Z.
Experiment and verification: Tan, F.; Lan, J.; Xu, W.
Manuscript drafting: Tan, F.; Jiang, Y.
Manuscript editing: Tan, F.; Jiang, Y.; Wang, M.
Review and approval of the final manuscript: Jiang, Y.; Wang, M.; Xiao, Z.; Xu, G.; Li, Z.
Availability of data and materials
The data supporting the findings of this study are available from the corresponding author upon reasonable request.
AI and AI-assisted tools statement
Not applicable.
Financial support and sponsorship
The authors acknowledge the financial supports by the Advanced Materials-National Science and Technology Major Project (Grant No. 2025ZD0612100), National Key Research and Development Program of China (Grant No. 2023YFB3812603), Fundamental and Interdisciplinary Disciplines Breakthrough Plan of the Ministry of Education of China (Grant No. JYB2025XDXM409), the National Natural Science Foundation of China (Grant No. 52371038), the Science and Technology Innovation Program of Hunan Province (2023RC1019). The Article Processing Charge (APC) was fully funded by Shaanxi Sirui Advanced Materials Co., Ltd.
Conflicts of interest
Jiang, Y. and Xiao, Z. are the Guest Editors of the special topic “AI-Driven Design and Intelligent Manufacturing of Advanced Copper Alloy” of Journal of Materials Informatics, but were not involved in any steps of editorial processing, notably including reviewer selection, manuscript handling, and decision making, while the other authors have declared that they have no conflicts of interest.
Ethical approval and consent to participate
Not applicable.
Consent for publication
Not applicable.
Copyright
© The Author(s) 2026.
Supplementary Materials
REFERENCES
1. Song, Y.; Xu, S.; Sato, S.; et al. A lightweight shape-memory alloy with superior temperature-fluctuation resistance. Nature 2025, 638, 965-71.
2. Xia, Z.; Huang, X.; Liu, J.; et al. Designing Ni2MnSn Heusler magnetic nanoprecipitate in copper alloy for increased strength and electromagnetic shielding. Nat. Commun. 2024, 15, 10494.
3. Liu, B.; Zhang, X.; Huang, Z.; et al. Microstructure and properties of a novel ultra-high strength, high elasticity and high plasticity Cu–20Ni–20Mn-0.3Nb-0.3Cr-0.1Zr alloy. J. Alloys. Compd. 2021, 853, 157402.
4. Liu, B.; Liu, J.; Liu, Y.; et al. Effects of Al addition on corrosion behavior and mechanical property of high-strength and high-elasticity Cu–20Ni–20Mn–0.3Nb–0.3Cr–0.3Zr alloy. Mater. Charact. 2020, 167, 110476.
5. He, B. B.; Hu, B.; Yen, H. W.; et al. High dislocation density-induced large ductility in deformed and partitioned steels. Science 2017, 357, 1029-32.
6. Zhu, Y.; Wu, X. Ductility and plasticity of nanostructured metals: differences and issues. Mater. Today. Nano. 2018, 2, 15-20.
7. Wang, Y.; Huang, C.; Ma, X.; et al. The optimum grain size for strength-ductility combination in metals. Int. J. Plast. 2023, 164, 103574.
8. Laws, K. J.; Crosby, C.; Sridhar, A.; et al. High entropy brasses and bronzes - microstructure, phase evolution and properties. J. Alloys. Compd. 2015, 650, 949-61.
9. Nagase, T.; Shibata, A.; Matsumuro, M.; Takemura, M.; Semboshi, S. Alloy design and fabrication of ingots in Cu-Zn-Mn-Ni-Sn high-entropy and Cu-Zn-Mn-Ni medium-entropy brasses. Mater. Design. 2019, 181, 107900.
10. Gao, J.; Jiang, S.; Zhang, H.; et al. Facile route to bulk ultrafine-grain steels for high strength and ductility. Nature 2021, 590, 262-7.
11. Zeng, K.; Hu, R.; Zhang, J.; et al. Finely tailoring the local ensembles in heterostructured high entropy alloy catalysts through pulsed annealing. Nat. Commun. 2025, 16, 3403.
12. Woodgate, C. D.; Marchant, G. A.; Pártay, L. B.; Staunton, J. B. Structure, short-range order, and phase stability of the AlxCrFeCoNi high-entropy alloy: insights from a perturbative, DFT-based analysis. npj. Comput. Mater. 2024, 10, 1445.
13. Wang, X.; Wang, R.; Sun, S.; et al. Amorphous phase-change memory alloy with no resistance drift. Nat. Mater. 2026, 25, 456-62.
14. Fu, X.; Wang, X. D.; Zhao, B.; et al. Atomic-scale observation of non-classical nucleation-mediated phase transformation in a titanium alloy. Nat. Mater. 2022, 21, 290-6.
15. Guo, Q.; Hou, H.; Wang, K.; Li, M.; Liaw, P. K.; Zhao, Y. Coalescence of Al0.3CoCrFeNi polycrystalline high-entropy alloy in hot-pressed sintering: a molecular dynamics and phase-field study. npj. Comput. Mater. 2023, 9, 1139.
16. Gao, S.; Ji, W.; Zhu, Q.; et al. Unveiling the mechanisms of strength-ductility synergy in an additively manufactured nanolamellar high-entropy alloy. Nat. Commun. 2025, 16, 9934.
17. Tsai, S. T.; Kuo, E. J.; Tiwary, P. Learning molecular dynamics with simple language model built upon long short-term memory neural network. Nat. Commun. 2020, 11, 5115.
18. Yin, J.; Lei, Q.; Li, X.; et al. A novel neural network-based alloy design strategy: gated recurrent unit machine learning modeling integrated with orthogonal experiment design and data augmentation. Acta. Mater. 2023, 243, 118420.
19. Wen, C.; Wang, C.; Zhang, Y.; et al. Modeling solid solution strengthening in high entropy alloys using machine learning. Acta. Mater. 2021, 212, 116917.
20. Li, B.; Du, Y.; Zheng, Z. S.; et al. Manipulation of mechanical properties of 7xxx aluminum alloy via a hybrid approach of machine learning and key experiments. J. Mater. Res. Technol. 2022, 19, 2483-96.
21. Masood Chaudry, U.; Hamad, K.; Abuhmed, T. Machine learning-aided design of aluminum alloys with high performance. Mater. Today. Commun. 2021, 26, 101897.
22. Sanni, O.; Adeleke, O.; Ukoba, K.; Ren, J.; Jen, T. Application of machine learning models to investigate the performance of stainless steel type 904 with agricultural waste. J. Mater. Res. Technol. 2022, 20, 4487-99.
23. Singh, A.; Nath, A.; Shekhar Roy, S.; Kumar Lohar, A. Modeling of laser aided direct metal deposition of stainless steel using supervised deep learning algorithms. Mater. Today. Proc. 2022, 62, 360-6.
24. Müller, S.; Sauter, C.; Shunmugasundaram, R.; et al. Deep learning-based segmentation of lithium-ion battery microstructures enhanced by artificially generated electrodes. Nat. Commun. 2021, 12, 6205.
25. Jiang, Z.; Li, J.; Yang, Y.; et al. Machine-learning-revealed statistics of the particle-carbon/binder detachment in lithium-ion battery cathodes. Nat. Commun. 2020, 11, 2310.
26. Zhang, H.; Fu, H.; He, X.; et al. Dramatically enhanced combination of ultimate tensile strength and electric conductivity of alloys via machine learning screening. Acta. Mater. 2020, 200, 803-10.
27. Zhang, H.; Fu, H.; Zhu, S.; Yong, W.; Xie, J. Machine learning assisted composition effective design for precipitation strengthened copper alloys. Acta. Mater. 2021, 215, 117118.
28. Tan, F.; Jiang, Y.; Lei, Q.; et al. A strategy for high-entropy copper alloys composition design assisted by deep learning based on data reconstruction and network structure optimization. J. Mater. Res. Technol. 2024, 31, 1326-36.
29. Tan, F.; Zhao, Z.; Jiang, Y.; et al. Dual engine-driven strategy for advanced copper alloy design employing large language models. Acta. Mater. 2026, 306, 121886.
30. Tang, M.; Zhang, D.; Wang, D.; Deng, J.; Kong, D.; Zhang, H. Performance prediction of 2D vertically stacked MoS2-WS2 heterostructures base on first-principles theory and Pearson correlation coefficient. Appl. Surf. Sci. 2022, 596, 153498.
31. Baak, M.; Koopman, R.; Snoek, H.; Klous, S. A new correlation coefficient between categorical, ordinal and interval variables with Pearson characteristics. Comput. Stat. Data. Anal. 2020, 152, 107043.
32. Xu, H.; Croot, P.; Zhang, C. Exploration of the spatially varying relationships between lead and aluminium concentrations in the topsoil of northern half of Ireland using Geographically Weighted Pearson Correlation Coefficient. Geoderma 2022, 409, 115640.
33. Fu, T.; Tang, X.; Cai, Z.; Zuo, Y.; Tang, Y.; Zhao, X. Correlation research of phase angle variation and coating performance by means of Pearson’s correlation coefficient. Prog. Org. Coat. 2020, 139, 105459.
34. Zhang, H.; Li, S.; Zhu, Y.; Zhang, S.; Wang, B.; Gao, Y. Microstructure evolution, mechanical properties, and wear properties of AlxCoCrFeNi high-entropy alloys by spark plasma sintering. J. Mater. Eng. Perform. 2026, 35, 18225-39.
35. Lu, Y.; Dong, Y.; Guo, S.; et al. A promising new class of high-temperature alloys: eutectic high-entropy alloys. Sci. Rep. 2014, 4, 6200.
36. Miracle, D.; Senkov, O. A critical review of high entropy alloys and related concepts. Acta. Mater. 2017, 122, 448-511.
37. Li, Z.; Pradeep, K. G.; Deng, Y.; Raabe, D.; Tasan, C. C. Metastable high-entropy dual-phase alloys overcome the strength-ductility trade-off. Nature 2016, 534, 227-30.
38. Mizutani, U.; Sato, H.; Massalski, T. The original concepts of the Hume-Rothery rule extended to alloys and compounds whose bonding is metallic, ionic, or covalent, or a changing mixture of these. Prog. Mater. Sci. 2021, 120, 100719.
39. Yang, S.; Liu, G.; Zhong, Y. Revisit the VEC criterion in high entropy alloys (HEAs) with high-throughput ab initio calculations: a case study with Al-Co-Cr-Fe-Ni system. J. Alloys. Compd. 2022, 916, 165477.
40. Ward, L.; Agrawal, A.; Choudhary, A.; Wolverton, C. A general-purpose machine learning framework for predicting properties of inorganic materials. npj. Comput. Mater. 2016, 2, 16028.
41. Guo, S.; Liu, C. Phase stability in high entropy alloys: formation of solid-solution phase or amorphous phase. Prog. Nat. Sci. Mater. Int. 2011, 21, 433-46.
42. Konovalova, E. V.; Perevalova, O. B.; Koneva, N. A.; Smirnov, A. I.; Kozlov, E. V. Influence of the antiphase domain structure on the long-range atomic order parameter in the Ni3Mn alloy with superstructure L12. Phys. Solid. State. 2013, 55, 2116-9.
43. Dong, Y.; Lu, Y.; Jiang, L.; Wang, T.; Li, T. Effects of electro-negativity on the stability of topologically close-packed phase in high entropy alloys. Intermetallics 2014, 52, 105-9.
44. Yang, X.; Zhang, Y. Prediction of high-entropy stabilized solid-solution in multi-component alloys. Mater. Chem. Phys. 2012, 132, 233-8.
45. Larosa, C. R.; Shih, M.; Varvenne, C.; Ghazisaeidi, M. Solid solution strengthening theories of high-entropy alloys. Mater. Charact. 2019, 151, 310-7.
46. Toda-Caraballo, I.; Rivera-Díaz-Del-Castillo, P. E. Modelling solid solution hardening in high entropy alloys. Acta. Mater. 2015, 85, 14-23.
47. Kim, Y. K.; Yang, S.; Lee, K. A. Superior temperature-dependent mechanical properties and deformation behavior of equiatomic CoCrFeMnNi high-entropy alloy additively manufactured by selective laser melting. Sci. Rep. 2020, 10, 8045.
48. Ding, J.; Wang, Z. Local chemical order in high-entropy alloys. Acta. Metall. Sin. 2021, 57, 413-24.
49. Labusch, R. A statistical theory of solid solution hardening. Phys. Status. Solidi. 1970, 41, 659-69.
50. Ding, J.; Yu, Q.; Asta, M.; Ritchie, R. O. Tunable stacking fault energies by tailoring local chemical order in CrCoNi medium-entropy alloys. Proc. Natl. Acad. Sci. U. S. A. 2018, 115, 8919-24.
51. Otto, F.; Dlouhý, A.; Somsen, C.; Bei, H.; Eggeler, G.; George, E. The influences of temperature and microstructure on the tensile properties of a CoCrFeMnNi high-entropy alloy. Acta. Mater. 2013, 61, 5743-55.
52. Senkov, O.; Wilks, G.; Miracle, D.; Chuang, C.; Liaw, P. Refractory high-entropy alloys. Intermetallics 2010, 18, 1758-65.
53. Varvenne, C.; Luque, A.; Curtin, W. A. Corrigendum to “Theory of strengthening in fcc high entropy alloys” [Acta Mater. 118 (2016) 164-176]. Acta. Mater. 2016, 119, 242.
Cite This Article
How to Cite
Download Citation
Export Citation File:
Type of Import
Tips on Downloading Citation
Citation Manager File Format
Type of Import
Direct Import: When the Direct Import option is selected (the default state), a dialogue box will give you the option to Save or Open the downloaded citation data. Choosing Open will either launch your citation manager or give you a choice of applications with which to use the metadata. The Save option saves the file locally for later use.
Indirect Import: When the Indirect Import option is selected, the metadata is displayed and may be copied and pasted as needed.
About This Article
Special Topic
Copyright

Data & Comments
Data
0


Comments
Comments must be written in English. Spam, offensive content, impersonation, and private information will not be permitted. If any comment is reported and identified as inappropriate content by OAE staff, the comment will be removed without notice. If you have any queries or need any help, please contact us at support@oaepublish.com.